
June 2026 marked a further, more pronounced step in the moderation of electricity prices across the National Electricity Market, with year-on-year declines steepening considerably from the prior month. Key developments during the month included:
- NEM spot prices fell 63.4% year-on-year to $84.82/MWh, with Victoria recording the largest reduction across the mainland states at -74.7%
- Renewable generation increased to 40.0% of total supply, driven by strong growth in wind and hydro output
- Battery discharge more than doubled compared with June 2025, continuing the accelerating trend observed in recent months
- Forward electricity prices fell to multi-year lows in New South Wales and Queensland, while South Australia diverged, with prices rising following a cluster of market price cap events late in the month
These outcomes reflect the continued evolution of the electricity market as renewable and storage capacity expands across the NEM. While the national trend was firmly downward, regional differences remained pronounced, with South Australia’s experience underscoring that supply-side volatility has not been fully displaced by the broader easing in prices.
National Electricity Update
Spot Prices
Spot prices across the National Electricity Market (NEM) declined sharply in June 2026 compared with June 2025, with all regions recording significant year-on-year reductions. The comparison is particularly striking given that June 2025 was an elevated month across the NEM, with all regions pricing well above typical levels.
The NEM average fell 63.4% year-on-year to $84.82/MWh. VIC recorded the largest reduction at -74.7%, while SA, despite falling 49.8%, was the only mainland region to close above $100/MWh at $125.73/MWh — driven by a series of market cap events on 21-22 June. NSW, QLD and TAS all settled in a narrow $71-$84/MWh band, suggesting a broadly aligned supply environment across the eastern states. The full-year FY2025-26 average underscores the structural shift in pricing: NSW finished the financial year at $78.45/MWh, QLD at $65.47/MWh and VIC at $53.21/MWh — all materially below FY2024-25 levels and, in VIC’s case, the lowest annual average in over a decade.
| Region | Jun-25 ($/MWh) | Jun-26 ($/MWh) | % Movement | 12M Avg ($/MWh) |
|---|---|---|---|---|
| NSW | 256.20 | 83.30 | -67.5% | 78.45 |
| QLD | 169.34 | 71.43 | -57.8% | 65.47 |
| SA | 250.40 | 125.73 | -49.8% | 78.67 |
| TAS | 219.34 | 76.83 | -65.0% | 78.17 |
| VIC | 264.60 | 66.81 | -74.7% | 53.21 |
| NEM Avg | 231.98 | 84.82 | -63.4% | 70.79 |
Futures Prices
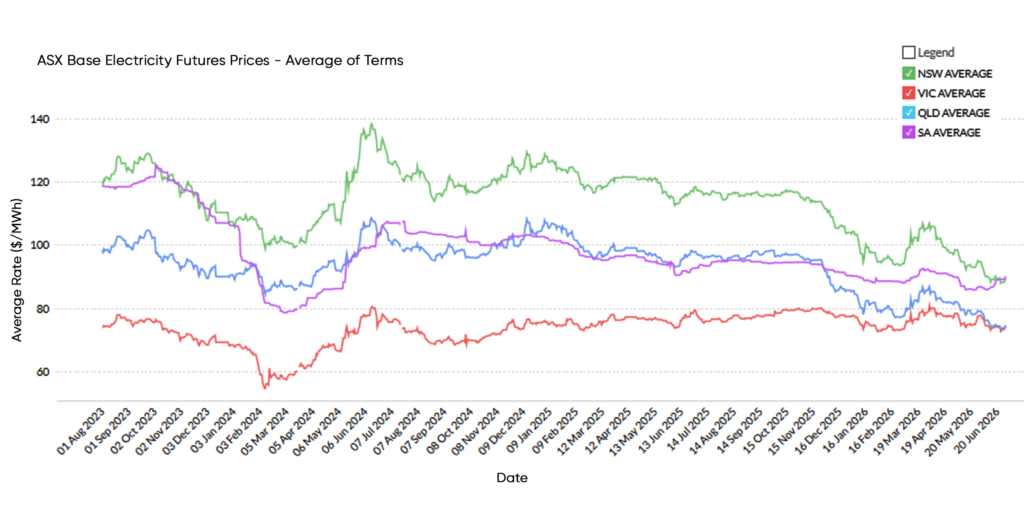
Forward prices continued to soften across most regions in June, extending the repricing trend that has been underway since early 2026. NSW and QLD both fell around 5-6%, pushing their forward curves to multi-year lows — NSW’s average of terms closed at $89.60/MWh, the lowest monthly close since February 2022, while QLD at $74.64/MWh reached its lowest point since January 2022.
SA was the notable exception, rising 3.8% during the month. This divergence is directly linked to the spot price spike in late June, which fed into near-term forward expectations. Despite the monthly rise, SA remains 8.8% below its 3-year average. VIC continues to track closely to its long-term average, the only region not in significant discount territory.
| Region | Month Open | Month Close | % Movement | LT Avg (Jan 23) | vs LT Avg |
| NSW | 94.77 | 89.60 | -5.5% | 114.51 | -21.8% |
| QLD | 79.14 | 74.64 | -5.7% | 94.16 | -20.7% |
| SA | 86.92 | 90.21 | +3.8% | 98.90 | -8.8% |
| VIC | 77.82 | 74.58 | -4.2% | 74.00 | +0.8% |
| NEM (Avg) | 84.66 | 82.26 | -2.8% | 95.39 | -13.8% |
Generation Mix
Total NEM generation fell modestly year-on-year (-2.8%) to 18,431 GWh. The headline shift was a 4.6 percentage point increase in renewable share to 40.0%, driven primarily by strong wind output (+15.5%) and a substantial increase in hydro generation (+12.0%). Solar contributed marginally (+2.9%), consistent with June being a low-solar winter month.
Battery discharge more than doubled year-on-year to 361 GWh, continuing the accelerating trend observed in recent months. Coal generation declined 8.3% and gas fell 28.4%, reflecting the displacement effect of growing renewables and storage. Emissions intensity improved by 6.1% to 557 kgCO₂e/MWh.
| Metric | Jun-25 | Jun-26 | Change |
|---|---|---|---|
| Total generation (GWh) | 18,969 | 18,431 | -2.8% |
| Renewable share (%) | 35.4% | 40.0% | +4.6% |
| Coal share (%) | 56.7% | 53.5% | -3.2% |
| Gas share (%) | 8.2% | 6.0% | -2.2 % |
| Wind (GWh) | 2,933 | 3,388 | +15.5% |
| Solar (GWh) | 2,513 | 2,586 | +2.9% |
| Hydro (GWh) | 1,376 | 1,541 | +12.0% |
| Battery discharge (GWh) | 153 | 361 | +136% |
| Emissions intensity (kgCO₂e/MWh) | 593 | 557 | -6.1% |
State Electricity Update
New South Wales
Spot
NSW average spot prices fell to $83.30/MWh in June 2026, down from $256.20/MWh in June 2025 (-67.5%). June 2025 was an exceptionally elevated month for NSW, so the year-on-year comparison overstates the underlying change. In isolation, $83.30/MWh represents a broadly normal winter pricing outcome for the state. The intra-month peak of $299.99/MWh on 24 June reflects a brief evening demand event rather than sustained tightness, with no intervals breaching the $1,000/MWh threshold during the month.
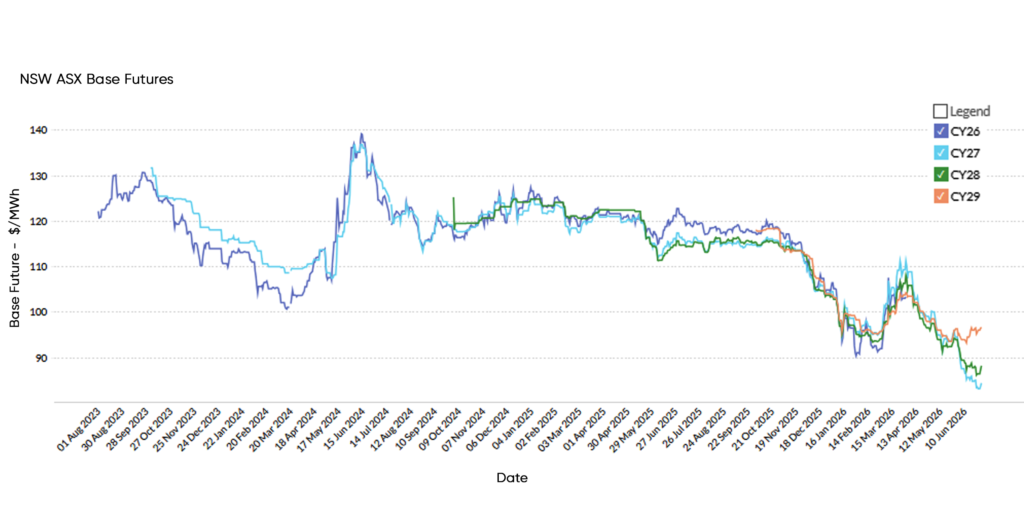
Futures
| Contract | Month Open | Month Close | % Change |
|---|---|---|---|
| CY27 | 94.34 | 84.24 | -10.7% |
| CY28 | 93.79 | 88.05 | -6.1% |
| CY29 | 96.18 | 96.50 | +0.3% |
NSW forward prices fell across all three contracts during June, with CY27 taking the largest move (-10.7%). The forward curve has now broken decisively below $100/MWh across CY27-CY28, with only CY29 holding marginally above at $96.50. The average of terms closed at $89.60/MWh, its lowest level since February 2022, and sits 21.8% below the 3-year average — reflecting sustained market confidence in NSW supply conditions as new renewable and storage capacity continues to come online.
Generation Mix
| Metric | Jun-25 | Jun-26 | Change |
|---|---|---|---|
| Total generation (GWh) | 6,985 | 6,529 | -6.5% |
| Renewable share (%) | 26.2% | 29.0% | +2.8% |
| Coal (GWh) | 4,300 | 3,804 | -11.5% |
| Gas (GWh) | 290 | 199 | -31.4% |
| Wind (GWh) | 555 | 635 | +14.4% |
| Solar (GWh) | 978 | 913 | -6.6% |
| Hydro (GWh) | 332 | 359 | +8.1% |
| Battery discharge (GWh) | 24.9 | 95 | +281% |
| Emissions intensity (kgCO₂e/MWh) | 635 | 593 | -6.6% |
NSW total generation declined 6.5% to 6,529 GWh. Renewable share improved by 2.8 percentage points to 29.0%, supported by stronger wind (+14.4%) and hydro (+8.1%) output. Coal generation fell 11.5% and gas declined 31.4%, the latter continuing a multi-month downward trend. Battery discharge increased significantly from 24.9 GWh to 95 GWh (+281%), reflecting the rapid expansion of storage capacity in the state. Emissions intensity improved 6.6% to 593 kgCO₂e/MWh.
Queensland
Spot
QLD average spot prices declined to $71.43/MWh from $169.34/MWh (-57.8%). As with other states, the June 2025 reference period was unusually elevated. QLD’s June 2026 outcome represents the lowest average spot price of any mainland state for the month, and sits well below its 12-month average, consistent with the broader market repricing observed since late 2025. No intervals exceeded $1,000/MWh during June, and 196 intervals (2.3%) recorded negative prices — concentrated on 3-4 June and 19 June — reflecting periods of excess renewable generation during daytime hours.
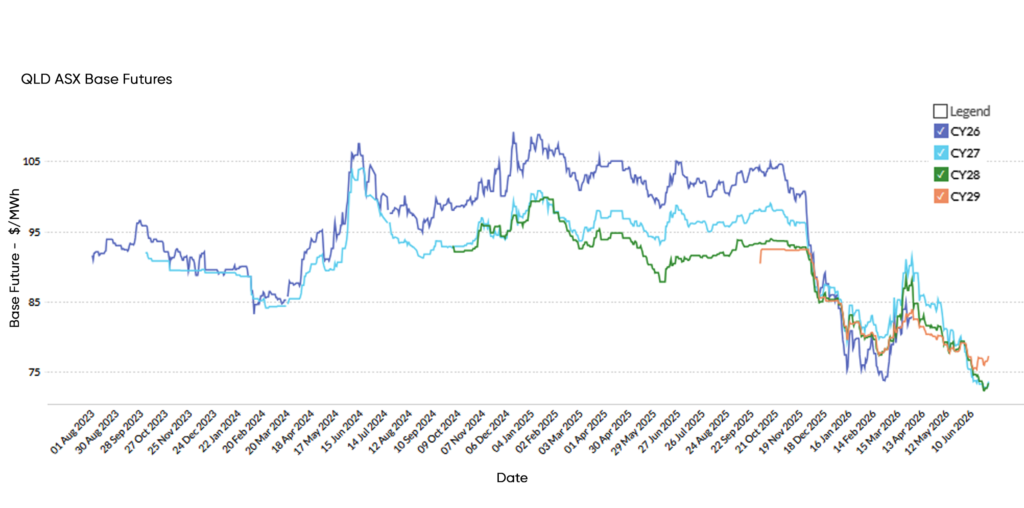
Futures
| Contract | Month Open | Month Close | % Change |
|---|---|---|---|
| CY27 | 79.15 | 73.50 | -7.1% |
| CY28 | 79.25 | 73.26 | -7.6% |
| CY29 | 79.01 | 77.15 | -2.4% |
QLD forward prices fell across all contracts, with the curve now sitting in a remarkably narrow $73-$77/MWh range across CY27-CY29. The CY27 contract declined 7.1% to $73.50/MWh — the most aggressive near-term repricing of any state. At $74.64/MWh on the average of terms, QLD is at its lowest since January 2022 and sits 20.7% below its 3-year average, the deepest discount of any mainland state.
Generation Mix
| Metric | Jun-25 | Jun-26 | Change |
|---|---|---|---|
| Total generation (GWh) | 5,114 | 5,054 | -1.2% |
| Renewable share (%) | 29.0% | 36.0% | +7.0% |
| Coal (GWh) | 3,759 | 3,160 | -15.9% |
| Gas (GWh) | 395 | 409 | +3.5% |
| Wind (GWh) | 402 | 636 | +58.2% |
| Solar (GWh) | 967 | 1,123 | +16.1% |
| Battery discharge (GWh) | 38 | 138 | +263% |
| Emissions intensity (kgCO₂e/MWh) | 630 | 555 | -11.9% |
QLD generation was broadly flat at 5,054 GWh (-1.2%). The standout shift was a 7.0 percentage point increase in renewable share to 36.0%, driven by strong wind growth (+58.2%) and continued solar expansion (+16.1%). Coal generation fell 15.9% — one of the larger reductions of any state — while gas rose modestly (+3.5%). Battery discharge nearly quadrupled from 38 to 138 GWh (+263%), reinforcing QLD’s accelerating storage uptake. Emissions intensity fell 11.9% to 555 kgCO₂e/MWh.
Victoria
Spot
VIC average spot prices fell to $66.81/MWh from $264.60/MWh (-74.7%), the largest year-on-year reduction across the NEM. June 2025 was an extreme outlier for VIC, so the comparison should be interpreted cautiously. The June 2026 outcome of $66.81/MWh is broadly consistent with recent months and reflects VIC’s position as the lowest-priced mainland state. Notably, 1,412 intervals (16.3%) recorded negative prices during the month, with the deepest negative reaching -$614.77/MWh on 12 June — likely reflecting a period of system surplus coinciding with limited export capacity.
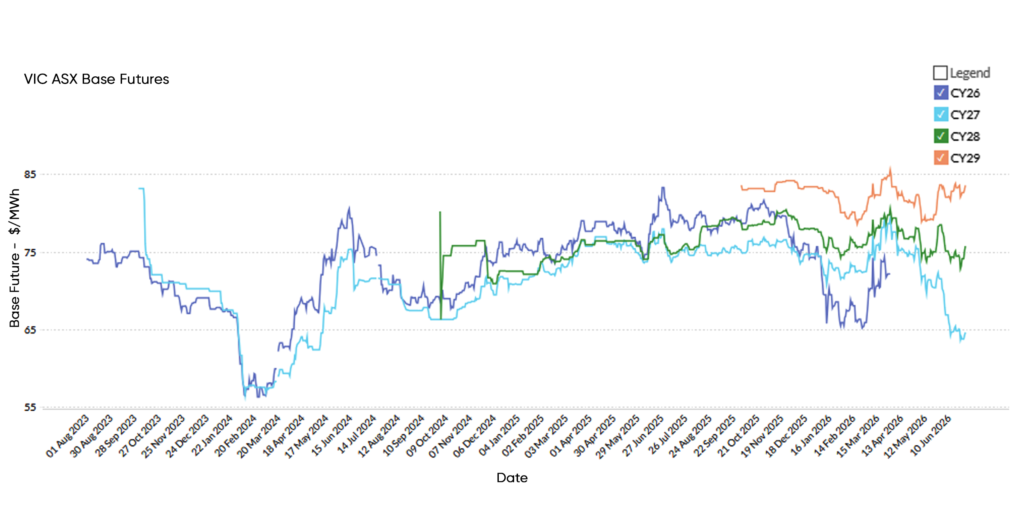
Futures
| Contract | Month Open | Month Close | % Change |
|---|---|---|---|
| CY27 | 71.48 | 64.55 | -9.7% |
| CY28 | 78.40 | 75.68 | -3.5% |
| CY29 | 83.57 | 83.50 | -0.1% |
VIC futures presented a mixed picture. CY27 fell 9.7% to $64.55/MWh — a sharp move — while CY28 declined modestly (-3.5%) and CY29 was essentially flat (-0.1%). The result is a steeper-than-usual forward curve, with CY29 at $83.50/MWh sitting significantly above CY27. VIC remains the only state tracking near its 3-year average on the average of terms (+0.8%), reflecting ongoing structural tightness in the state’s medium-term supply outlook as brown coal capacity continues to retire.
Generation Mix
| Metric | Jun-25 | Jun-26 | Change |
|---|---|---|---|
| Total generation (GWh) | 4,621 | 4,659 | +0.8% |
| Renewable share (%) | 38.8% | 40.2% | +1.4% |
| Coal (GWh) | 2,705 | 2,905 | +7.4% |
| Gas (GWh) | 383 | 162 | -57.7% |
| Wind (GWh) | 1,195 | 1,255 | +5.0% |
| Solar (GWh) | 358 | 340 | -5.0% |
| Hydro (GWh) | 266 | 320 | +20.3% |
| Battery discharge (GWh) | 52 | 86 | +65.4% |
| Emissions intensity (kgCO₂e/MWh) | 678 | 714 | +5.3% |
VIC total generation rose modestly to 4,659 GWh (+0.8%). Wind output increased 5.0% and hydro generation rose 20.3%, both contributing to a 1.4 percentage point improvement in renewable share to 40.2%. Coal generation increased 7.4% — the largest year-on-year rise of any state — while gas fell sharply (-57.7%), suggesting coal was the primary firming source during periods of renewable shortfall. Battery discharge increased 65.4% to 86 GWh. Emissions intensity rose 5.3% to 714 kgCO₂e/MWh, making VIC the only state to record a year-on-year deterioration in carbon intensity.
South Australia
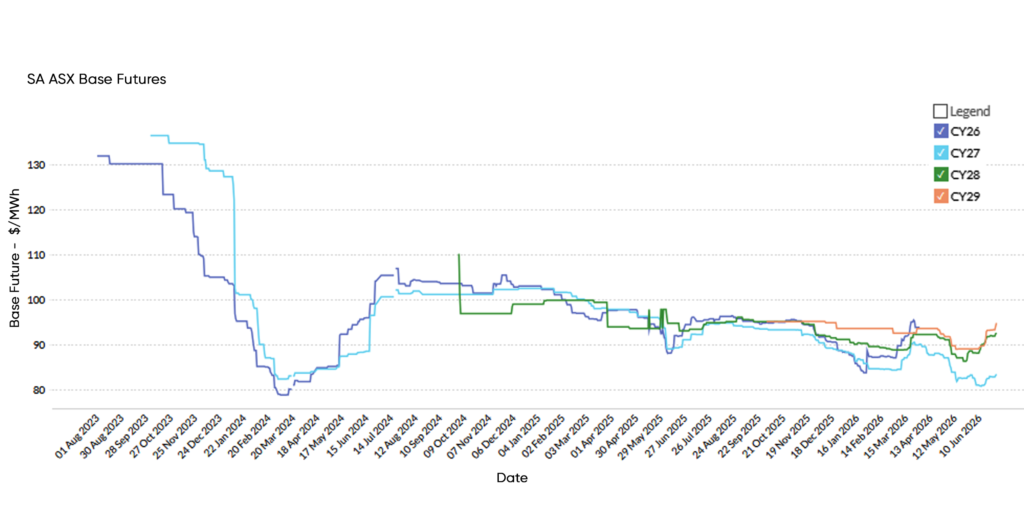
Spot
SA average spot prices fell to $125.73/MWh from $250.40/MWh (-49.8%). Despite the large year-on-year decline, SA was the only mainland state to average above $100/MWh in June 2026 — a result driven by a cluster of market price cap events ($20,300/MWh) on 21-22 June. Outside of these events, SA’s underlying pricing profile was broadly consistent with other states. The 1,677 negative price intervals during the month (19.4% of all trading intervals) highlight the volatility inherent in SA’s high-renewable, gas-firmed system.
Futures
| Contract | Month Open | Month Close | % Change |
|---|---|---|---|
| CY27 | 83.23 | 83.37 | +0.2% |
| CY28 | 88.54 | 92.51 | +4.5% |
| CY29 | 89.00 | 94.74 | +6.4% |
SA futures diverged from the rest of the NEM in June, rising 3.8% on the average of terms to $90.21/MWh. The spot price spike on 21-22 June appears to have fed into near-term market pricing. This is most evident in CY28 (+4.5%) and CY29 (+6.4%), suggesting the market is pricing in ongoing supply adequacy risk in SA’s outer years. CY27 was essentially flat (+0.2%), with the bulk of the repricing in later contracts.
Generation Mix
| Metric | Jun-25 | Jun-26 | Change |
|---|---|---|---|
| Total generation (GWh) | 1,314 | 1,272 | -3.2% |
| Renewable share (%) | 62.4% | 69.7% | +7.3% |
| Wind (GWh) | 653 | 730 | +11.8% |
| Solar (GWh) | 195 | 194 | -0.5% |
| Gas (GWh) | 465 | 336 | -27.7% |
| Imports (GWh) | 103 | 105 | +1.9% |
| Battery discharge (GWh) | 38 | 42 | +10.5% |
| Emissions intensity (kgCO₂e/MWh) | 231 | 194 | -16.0% |
SA total generation declined 3.2% to 1,272 GWh. Despite the spot price spike, SA’s generation mix continued to improve from an emissions perspective — renewable share rose 7.3 percentage points to 69.7%, with wind the primary driver (+11.8%). Gas generation fell significantly (-27.7%), replaced partly by wind and partly by higher imports. Emissions intensity declined 16.0% to 194 kgCO₂e/MWh, one of the strongest improvements of any state. Wind curtailment remained elevated at 64 GWh, consistent with periods of oversupply during the month.
Closing Commentary
June reinforced, and in several respects accelerated, the broader trend of improving supply conditions across the National Electricity Market. Continued growth in wind and hydro generation, rapidly expanding battery participation and reduced reliance on gas generation all supported a further round of competitive wholesale pricing outcomes across most of the market.
The scale of the forward price decline in New South Wales and Queensland is particularly notable, with both regions now trading at their lowest levels since early 2022. This suggests growing market confidence in the ability of new renewable and storage capacity to meet future supply requirements. South Australia’s divergence, however — driven by a cluster of price cap events in late June — is a reminder that regional supply adequacy risk remains uneven across the NEM, even as the national picture continues to improve.
As renewable penetration increases, factors such as curtailment, storage deployment, transmission constraints and localised supply events will continue to play an important role in shaping regional market outcomes. Leading Edge Energy will continue to monitor these developments closely to help clients navigate changing market conditions, manage risk and make informed energy procurement decisions.
Explainer: Why we focus on Wholesale Futures Prices
Wholesale Futures Price: This reflects what the market expects wholesale electricity spot rates to be in future periods. The offers that commercial and industrial (C&I) customers receive via Leading Edge Energy are closely correlated to wholesale prices on the ASX Energy futures market; this is why we focus on these prices in our commentary.
Spot Price: This represents how much the spot market is charging for electricity currently based on demand and supply. Spot prices go up when demand is high and supply is tight. You can view live Spot Prices here.
You can learn more about the difference between wholesale electricity futures and spot prices in our blog section.
Disclaimer: The information in this communication is for general information purposes only. It is not intended as financial or investment advice and should not be interpreted or relied upon as such.
We source, analyse, compare and rank commercial, industrial and multi-site energy quotes. Obligation Free.
Chat with one of our experienced consultants today and get the insights your business needs to help manage the risks associated with volatile electricity and natural gas markets. Our energy procurement service is obligation-free and provides a time-saving way of securing lower energy rates from our panel of energy retailers.
Get advice from our Energy Management Consultants

Ewen Beard
Sales Manager
Get in Touch
Feel free to call or e-mail us. Or just fill in the form below and we’ll contact you for an obligation-free discussion.
Are you ready to save on business energy costs?
Get StartedLeading Edge Energy is proud to be a signatory of the National Customer Code for Energy Brokers, Consultants and Retailers.