
August 2026 saw a renewed acceleration in the downward pricing trend across the National Electricity Market, following a quieter period of consolidation in July. Key developments during the month included:
- NEM spot prices fell 32.7% year-on-year to $65.22/MWh — the lowest average August price in several years — with all five regions recording double-digit declines
- South Australia remained the highest-priced mainland state for the third consecutive month at $71.62/MWh, as reduced wind output drove greater reliance on gas and interconnector imports
- Forward electricity prices were mixed across regions, with Queensland the most active mover, rising 3.3% on the month, while New South Wales and South Australia eased slightly
- Renewable generation reached a record 41.7% of total supply, supported by strong solar and hydro growth, even as wind output declined modestly
- Battery discharge rose 203% year-on-year to 513 GWh, continuing its rapid expansion across the market
These outcomes reflect a market in which the structural shift toward renewables and storage continues to weigh on average pricing, even as individual regions experience distinct short-term pressures tied to local generation conditions.
National Electricity Update
Spot Prices
Spot prices across the National Electricity Market (NEM) fell materially in August 2026 compared with August 2025, with all five regions recording double-digit year-on-year declines. The NEM average dropped 32.7% year-on-year to $65.22/MWh — the lowest average August price in several years — as improved supply conditions, continued renewable growth and accelerating battery deployment weighed on wholesale pricing.
TAS recorded the sharpest year-on-year decline (-53.7%), reversing an elevated August 2025 period. VIC fell 35.2% year-on-year to $60.40/MWh, while NSW and QLD both declined around 22-25% year-on-year. SA, at $71.62/MWh, recorded the most modest fall (-17.5% year-on-year), but remained the highest-priced mainland state for the second consecutive month — a pattern driven by reduced wind output and heavier interconnector reliance. QLD at $60.42/MWh was the lowest-priced mainland state.
| Region | Aug-25 ($/MWh) | Aug-26 ($/MWh) | % Movement |
|---|---|---|---|
| NSW | 101.25 | 75.71 | -25.2% |
| QLD | 78.20 | 60.42 | -22.7% |
| SA | 86.86 | 71.62 | -17.5% |
| TAS | 125.22 | 57.95 | -53.7% |
| VIC | 93.19 | 60.40 | -35.2% |
| NEM Avg | 96.94 | 65.22 | -32.7% |
Futures Prices
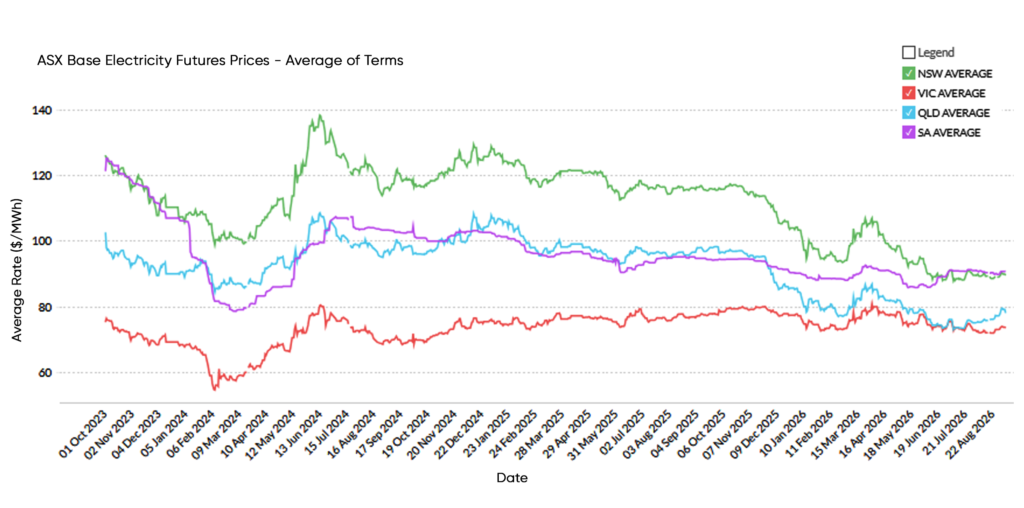
Forward markets were mixed in August, with NSW and SA easing slightly while QLD and VIC nudged marginally higher. Overall, the average of terms moved within a narrow band across all regions, reflecting a market that has stabilised following several months of sustained repricing.
QLD was the most notable mover, with the average of terms rising 3.3% on the month — driven in part by stronger-than-expected CY28 demand (+5.5% on the individual contract). Despite the monthly lift, QLD at $77.72/MWh remains 16.2% below its 3-year average. NSW at $89.43/MWh and QLD at $77.72/MWh continue to sit at their lowest sustained levels since early 2022, reinforcing the case for customers to consider longer-term fixation while the market remains at multi-year lows.
| Region | Month Open | Month Close | % Movement | 3yr Avg | vs 3yr Avg |
| NSW | 89.71 | 89.43 | -0.3% | 112.42 | -20.5% |
| QLD | 75.21 | 77.72 | +3.3% | 92.70 | -16.2% |
| SA | 91.12 | 90.10 | -1.1% | 97.24 | -7.3% |
| VIC | 73.02 | 73.29 | +0.4% | 73.72 | -0.6% |
| NEM (Avg) | 82.27 | 82.64 | +0.5% | 94.02 | -12.1% |
Generation Mix
Total NEM generation rose modestly year-on-year (+0.8%) to 19,299 GWh. Renewable share increased to 41.7% — a new August record — driven by strong solar growth (+15.5%) and improved hydro output (+12.8%). Wind generation fell slightly (-3.5%), partially offsetting the solar and hydro gains.
Battery discharge accelerated sharply, rising 203% year-on-year to 513 GWh. Gas generation fell 47.2% — one of the largest year-on-year declines on record for the NEM — as batteries and renewables displaced dispatchable thermal capacity at scale. Coal generation was essentially flat (+1.1%). Emissions intensity improved modestly to 553 kgCO₂e/MWh (-1.4%).
| Metric | Aug-25 | Aug-26 | Change |
|---|---|---|---|
| Total generation (GWh) | 19,143 | 19,299 | +0.8% |
| Renewable share (%) | 39.7% | 41.7% | +2.0 % |
| Coal share (GWh) | 10,382 | 10,498 | +1.1 % |
| Gas (GWh) | 1,208 | 638 | -47.2 % |
| Wind (GWh) | 3,204 | 3,091 | -3.5% |
| Solar (GWh) | 3,371 | 3,893 | +15.5% |
| Hydro (GWh) | 1,140 | 1,286 | +12.8% |
| Battery discharge (GWh) | 169 | 513 | +203% |
| Emissions intensity (kgCO₂e/MWh) | 561 | 553 | -1.4% |
State Electricity Update
New South Wales
Spot
NSW average spot prices fell to $75.71/MWh in August 2026, down 25.2% year-on-year from $101.25/MWh in August 2025. The result is broadly in line with NSW’s rolling annual average, reflecting a market that has normalised following the elevated conditions of 2024-25 rather than continuing to soften. Gas generation collapsed 76.8% year-on-year to just 52 GWh, with battery discharge growing nearly fivefold to fill the gap — a shift that signals the structural displacement of peaking gas by grid-scale storage.
Futures
| Contract | Month Open | Month Close | % Change |
|---|---|---|---|
| CY27 | 83.43 87.05 98.65 | 85.10 87.16 96.02 | +2.0% +0.1% -2.7% |
| CY28 | 89.02 | 87.05 | -2.2% |
| CY29 | 97.25 | 98.65 | +1.4% |
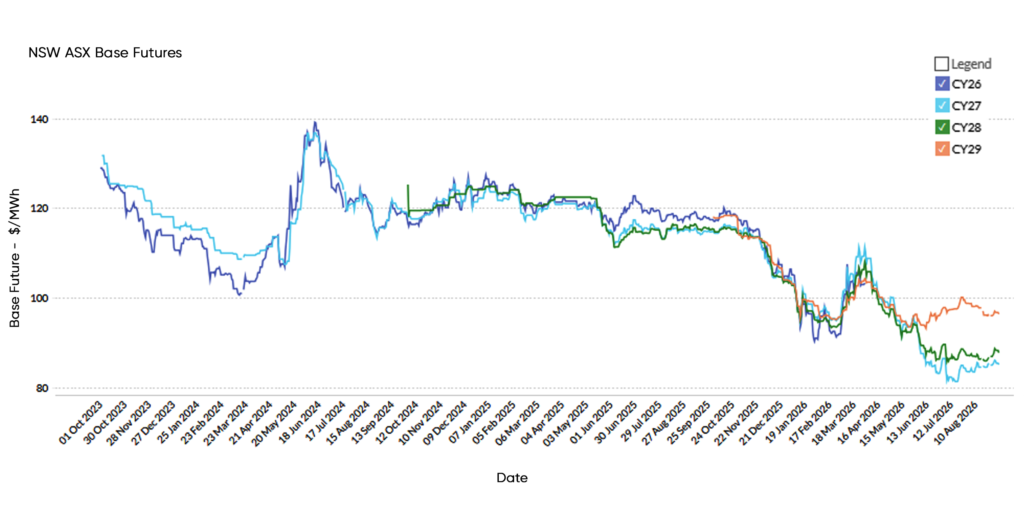
NSW forward prices were broadly stable during August — CY27 edged up 2.0% over the month, CY28 was essentially flat (+0.1%), and CY29 eased slightly (-2.7%). The flat-to-mixed movement reflects a market consolidating at multi-year lows rather than continuing to reprice. At $89.43/MWh on the average of terms, NSW is 20.5% below its 3-year average and has not sustained these levels since early 2022.
Generation Mix
| Metric | Aug-25 | Aug-26 | Change |
|---|---|---|---|
| Total generation (GWh) | 6,982 | 6,906 | -1.1% |
| Renewable share (%) | 31.0% | 32.6% | +1.6% |
| Coal (GWh) | 4,040 | 3,905 | -3.3% |
| Gas (GWh) | 224 | 52 | -76.8% |
| Wind (GWh) | 749 | 589 | -21.4% |
| Solar (GWh) | 1,236 | 1,466 | +18.6% |
| Hydro (GWh) | 202 | 253 | +25.2% |
| Battery discharge (GWh) | 31 | 183 | +490% |
| Imports (GWh) | 713 | 751 | +5.3% |
| Emissions intensity (kgCO₂e/MWh) | 593 | 570 | -3.9% |
NSW total generation edged lower (-1.1%) to 6,906 GWh. Solar output grew 18.6% and hydro rose 25.2%, while wind declined 21.4% — consistent with lower wind resource conditions across August. Battery discharge surged from 31 to 183 GWh (+490%), continuing the rapid acceleration observed in recent months. Gas generation fell sharply to just 52 GWh (-76.8%), its lowest level in recent memory. Coal declined 3.3%. Renewable share improved 1.6 percentage points to 32.6%, and emissions intensity fell 3.9% to 570 kgCO₂e/MWh.
Queensland
Spot
QLD average spot prices declined to $60.42/MWh in August 2026, down 22.7% year-on-year from $78.20/MWh in August 2025 — the lowest monthly average of any mainland state. Strong renewable growth — particularly solar (+21.8% year-on-year) and wind (+45.6% year-on-year) — combined with a sharp reduction in gas output (-69.3% year-on-year) drove a 6.1 percentage point improvement in renewable share to 39.1%. QLD’s pricing continues to benefit from one of the most rapidly evolving generation mixes on the NEM.
Futures
| Contract | Month Open | Month Close | % Change |
|---|---|---|---|
| CY27 | 73.32 73.27 79.04 | 75.44 77.28 80.43 | +2.9% +5.5% +1.8% |
| CY28 | 74.52 | 73.27 | -1.7% |
| CY29 | 78.35 | 79.04 | +0.9% |
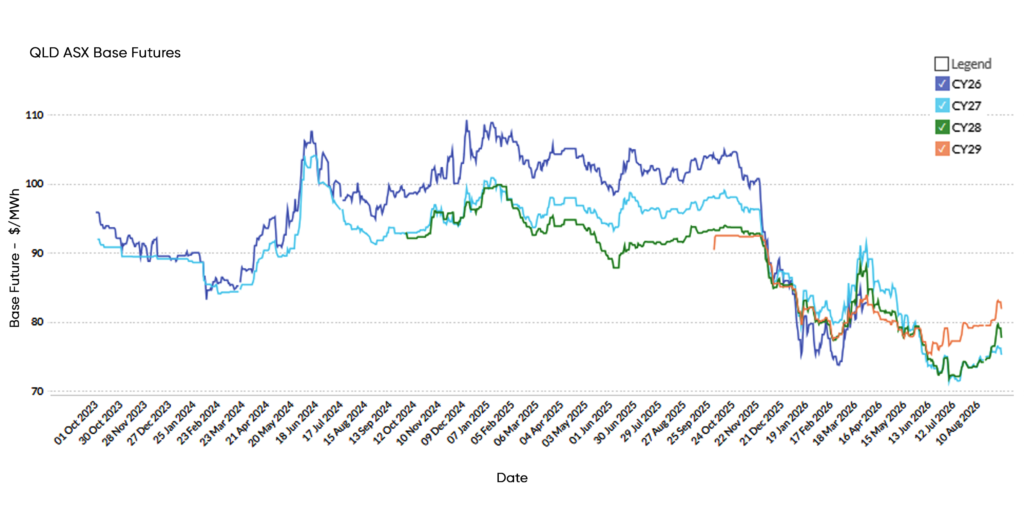
QLD was the most active state in the forward market during August. The average of terms rose 3.3% to $77.72/MWh, with CY28 (+5.5%) the standout contract. This reverses the steady decline in QLD futures observed over recent months and may reflect some market reassessment of medium-term supply conditions as coal output remains elevated and renewable build timelines are scrutinised. Despite the monthly lift, QLD sits 16.2% below its 3-year average.
Generation Mix
| Metric | Aug-25 | Aug-26 | Change |
|---|---|---|---|
| Total generation (GWh) | 5,215 | 5,263 | +0.9% |
| Renewable share (%) | 33.0% | 39.1% | +6.1% |
| Coal (GWh) | 3,574 | 3,579 | +0.1% |
| Gas (GWh) | 411 | 126 | -69.3% |
| Wind (GWh) | 388 | 565 | +45.6% |
| Solar (GWh) | 1,227 | 1,495 | +21.8% |
| Battery discharge (GWh) | 48 | 158 | +229% |
| Emissions intensity (kgCO₂e/MWh) | 595 | 563 | -5.4% |
QLD total generation rose 0.9% to 5,263 GWh. Renewable share improved 6.1 percentage points to 39.1%, driven by strong growth in both wind (+45.6%) and solar (+21.8%). Coal was essentially flat (+0.1%), while gas fell 69.3% — the largest proportional reduction of any fuel type in QLD. Battery discharge grew 229% from 48 to 158 GWh, continuing the acceleration trend. Emissions intensity improved 5.4% to 563 kgCO₂e/MWh.
Victoria
Spot
VIC average spot prices declined to $60.40/MWh in August 2026, down 35.2% year-on-year from $93.19/MWh in August 2025. The result reflects both the normalisation from elevated prior-year conditions and the broader downward repricing that has characterised VIC over the past year. At $60.40/MWh, VIC is the second-lowest priced mainland state after QLD — a reversal of its historically higher pricing position, driven by strong coal output and accelerating battery discharge suppressing peak pricing events.
Futures
| Contract | Month Open | Month Close | % Change |
|---|---|---|---|
| CY27 | 62.02 | 63.01 | +1.6% |
| CY28 | 72.26 | 73.26 | +1.4% |
| CY29 | 84.77 | 83.59 | -1.4% |
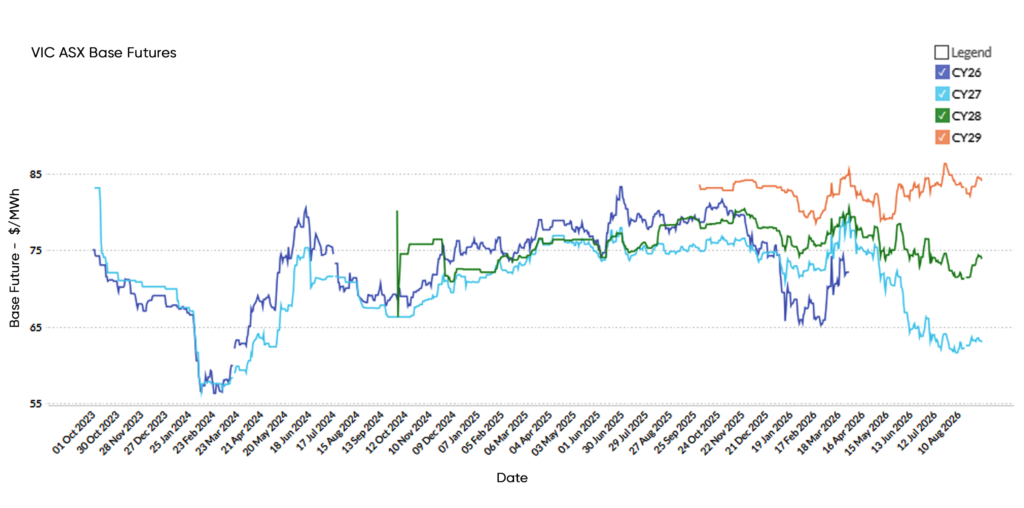
VIC forward prices edged higher across CY27 (+1.6%) and CY28 (+1.4%), with CY29 easing slightly (-1.4%). The modest monthly movements leave the forward curve broadly unchanged from July — steeply upward-sloping with CY27 at $63.01/MWh and CY29 at $83.59/MWh. VIC at $73.29/MWh on the average of terms is essentially at par with its 3-year average (-0.6%), the only mainland state not trading at a meaningful discount to its long-term benchmark.
Generation Mix
| Metric | Aug-25 | Aug-26 | Change |
|---|---|---|---|
| Total generation (GWh) | 4,692 | 4,921 | +4.9% |
| Renewable share (%) | 41.2% | 40.2% | -1.0 % |
| Coal (GWh) | 2,767 | 3,014 | +8.9% |
| Gas (GWh) | 139 | 60 | -56.8% |
| Wind (GWh) | 1,188 | 1,174 | -1.2% |
| Solar (GWh) | 586 | 614 | +4.8% |
| Hydro (GWh) | 187 | 247 | +32.1% |
| Battery discharge (GWh) | 60 | 125 | +108% |
| Imports (GWh) | 238 | 295 | +23.9% |
| Emissions intensity (kgCO₂e/MWh) | 676 | 693 | +2.5% |
VIC total generation rose 4.9% to 4,921 GWh. Solar grew 4.8% and hydro increased 32.1%, while wind was essentially flat (-1.2%). Coal rose 8.9% — the largest year-on-year increase of any state — as strong total generation demand was met partly by additional coal output. Gas fell sharply to 60 GWh (-56.8%). Battery discharge more than doubled from 60 to 125 GWh (+108%). Imports grew 23.9% to 295 GWh. Renewable share was broadly flat at 40.2% (-1.0 pp), and emissions intensity rose modestly to 693 kgCO₂e/MWh (+2.5%), reflecting the higher coal contribution.
South Australia
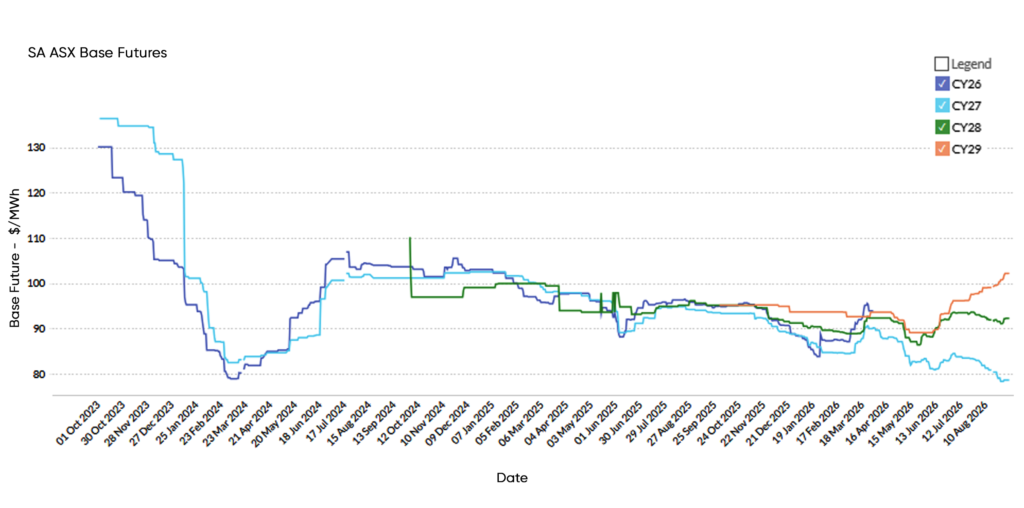
Spot
SA average spot prices fell to $71.62/MWh in August 2026, down 17.5% year-on-year from $86.86/MWh in August 2025. Despite the year-on-year decline, SA was again the highest-priced mainland state — the third consecutive month this has been the case. The pattern continues to reflect SA’s exposure to wind variability: wind output fell 15.8% year-on-year to 604 GWh, and renewable share dropped 8.0 percentage points to 66.7%. Imports more than doubled to 158 GWh as the state drew heavily on the interconnector to supplement reduced local renewable output. This structural dynamic — high renewable share but limited dispatchable backup — continues to create price premiums in periods of low wind.
Futures
| Contract | Month Open | Month Close | % Change |
|---|---|---|---|
| CY27 | 82.83 | 78.21 | -5.6% |
| CY28 | 92.91 | 91.22 | -1.8% |
| CY29 | 97.61 | 100.87 | +3.3% |
SA futures were mixed — CY27 fell 5.6%, reflecting near-term softness, while CY29 rose 3.3%, continuing to reflect supply adequacy concerns in the outer years. CY28 was broadly stable (-1.8%). The shape of the SA forward curve remains upward-sloping into the outer years, distinct from the flatter profiles seen in NSW and QLD, signaling ongoing market caution about SA’s medium-term firming capacity as the state transitions away from gas.
Generation Mix
| Metric | Aug-25 | Aug-26 | Change |
|---|---|---|---|
| Total generation (GWh) | 1,318 | 1,278 | -3.0% |
| Renewable share (%) | 74.7% | 66.7% | -8.0 % |
| Gas (GWh) | 356 | 309 | -13.2% |
| Wind (GWh) | 717 | 604 | -15.8% |
| Solar (GWh) | 298 | 287 | +3.7% |
| Battery discharge (GWh) | 30 | 46 | +53.3% |
| Imports (GWh) | 78 | 158 | +102.6% |
| Emissions intensity (kgCO₂e/MWh) | 170 | 211 | +24.1% |
SA total generation fell 3.0% to 1,278 GWh. Wind declined 15.8% to 604 GWh, driving an 8.0 percentage point reduction in renewable share to 66.7%. Solar also fell modestly (-3.7%). Gas output declined 13.2% despite the lower renewable availability, with the shortfall absorbed primarily by a doubling of imports to 158 GWh. Battery discharge increased 53.3% to 46 GWh. Emissions intensity rose 24.1% to 211 kgCO₂e/MWh — the largest year-on-year deterioration of any state for the second consecutive month.
Closing Commentary
August reinforced the extent to which renewable generation and battery storage are now shaping wholesale price outcomes across the National Electricity Market. A record renewable share of 41.7%, combined with a 47.2% year-on-year fall in gas generation, points to an accelerating displacement of dispatchable thermal capacity by lower-cost sources — a trend increasingly visible in the NEM average falling to its lowest August level in several years.
South Australia’s position as the highest-priced mainland state for a third consecutive month continues to highlight the flip side of high renewable penetration: exposure to wind variability. With wind output down 15.8% year-on-year and renewable share falling 8.0 percentage points, the state again drew heavily on imports to fill the gap — underscoring that supply adequacy risk has not disappeared, even as the broader market trends lower.
Queensland’s forward market activity — a 3.3% rise in the average of terms, led by a 5.5% lift in the CY28 contract — is worth watching in the months ahead, as it may signal early market reassessment of medium-term supply conditions in that state. Leading Edge Energy will continue to monitor these developments closely to help clients navigate changing market conditions, manage risk and make informed energy procurement decisions.
Explainer: Why we focus on Wholesale Futures Prices
Wholesale Futures Price: This reflects what the market expects wholesale electricity spot rates to be in future periods. The offers that commercial and industrial (C&I) customers receive via Leading Edge Energy are closely correlated to wholesale prices on the ASX Energy futures market; this is why we focus on these prices in our commentary.
Spot Price: This represents how much the spot market is charging for electricity currently based on demand and supply. Spot prices go up when demand is high and supply is tight.
You can learn more about the difference between wholesale electricity futures and spot prices in our blog section.
Disclaimer: The information in this communication is for general information purposes only. It is not intended as financial or investment advice and should not be interpreted or relied upon as such.
We source, analyse, compare and rank commercial, industrial and multi-site energy quotes. Obligation Free.
Chat with one of our experienced consultants today and get the insights your business needs to help manage the risks associated with volatile electricity and natural gas markets. Our energy procurement service is obligation-free and provides a time-saving way of securing lower energy rates from our panel of energy retailers.



Get advice from our Energy Management Consultants

Ewen Beard
Sales Manager
Get in Touch
Feel free to call or e-mail us. Or just fill in the form below and we’ll contact you for an obligation-free discussion.
Are you ready to save on business energy costs?
Get Started
Leading Edge Energy is proud to be a signatory of the National Customer Code for Energy Brokers, Consultants and Retailers.