
April 2026 delivered a further decline in electricity prices across the National Electricity Market, extending the softer pricing environment observed in recent months. Key developments during the month included:
- NEM spot prices fell 37.8% year-on-year, with the largest reductions in Victoria, Queensland and New South Wales.
- Renewable penetration increased to 44.2%, continuing to displace coal and gas generation.
- Battery discharge increased by over 200%, highlighting the growing role of storage in supporting system flexibility.
- Electricity futures prices softened across most regions, reversing part of the increases observed in March.
These outcomes reflect strong renewable output across the NEM and improved supply conditions, which have contributed to sustained downward pressure on wholesale pricing. The decline in forward prices further suggests increased market confidence, although pricing remains sensitive to broader system dynamics and external factors.
National Electricity Update
Spot Prices
Spot prices across the National Electricity Market (NEM) were significantly lower in April 2026 compared with April 2025, with all regions recording material year-on-year declines.
| Region | Apr-25 ($/MWh) | Apr-26 ($/MWh) | % Movement | 12M Avg ($/MWh) |
|---|---|---|---|---|
| NSW | 104.07 | 59.73 | -42.6% | 104.59 |
| QLD | 98.50 | 53.31 | -45.9% | 75.22 |
| SA | 88.82 | 56.18 | -36.7% | 89.24 |
| TAS | 100.53 | 85.24 | -15.2% | 90.53 |
| VIC | 74.76 | 35.68 | -52.3% | 70.59 |
| NEM Avg | 93.34 | 58.03 | -37.8% | 86.83 |
Victoria recorded the largest reduction in wholesale pricing, followed by Queensland and New South Wales.
The NEM average fell by 37.8% year-on-year, with April continuing the softer pricing environment observed in recent months. Current spot prices sit well below rolling 12-month averages across all mainland regions, highlighting the sharp compression in wholesale pricing following elevated conditions through mid-2025.
Futures Prices
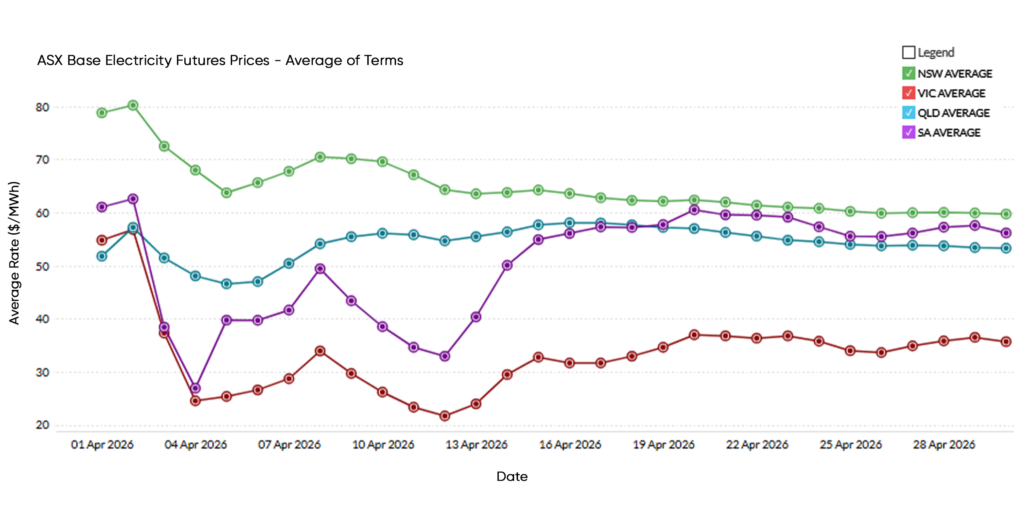
Futures prices softened across most regions during April, reversing part of the upward movement observed in March.
Despite this decline, forward prices remain below three-year averages across most regions, indicating continued confidence in underlying supply conditions. Victoria remains the exception, trading slightly above its long-term average.
| Region | Month Open | Month Close | % Movement | 3-Year Avg | Movement vs 3-Year Avg |
| NSW | 105.76 | 98.60 | -6.8% | 115.94 | -14.9% |
| QLD | 85.53 | 82.26 | -3.8% | 95.65 | -14.0% |
| SA | 92.38 | 89.92 | -2.7% | 96.38 | -6.7% |
| VIC | 78.45 | 78.58 | +0.2% | 75.55 | +4.0% |
| NEM (Avg) | 90.53 | 87.34 | -3.5% | 95.88 | -8.9% |
Generation Mix
| Metric | Apr-25 | Apr-26 | Change |
|---|---|---|---|
| Total generation (GWh) | 16,474 | 16,779 | +1.9% |
| Renewable share (%) | 39.2% | 44.2% | +5.0 % |
| Coal share (%) | 55.8% | 51.8% | -4.0 % |
| Gas share (%) | 4.5% | 2.2% | -2.3% |
| Battery discharge (GWh) | 95 | 322 | +239% |
| Renewable curtailment (GWh) | 317 | 571 | +80% |
| Emissions intensity (kgCO₂e/MWh) | 581 | 536 | -7.7% |
Renewable penetration increased materially, supported by strong wind and solar output. Coal and gas generation both declined, with gas showing the most significant reduction.
Battery discharge increased substantially, while curtailment also rose, reflecting ongoing system constraints during periods of high renewable output.
State Electricity Update
New South Wales
Spot
NSW average spot prices declined to $59.73/MWh, down from $104.07/MWh (-42.6%).
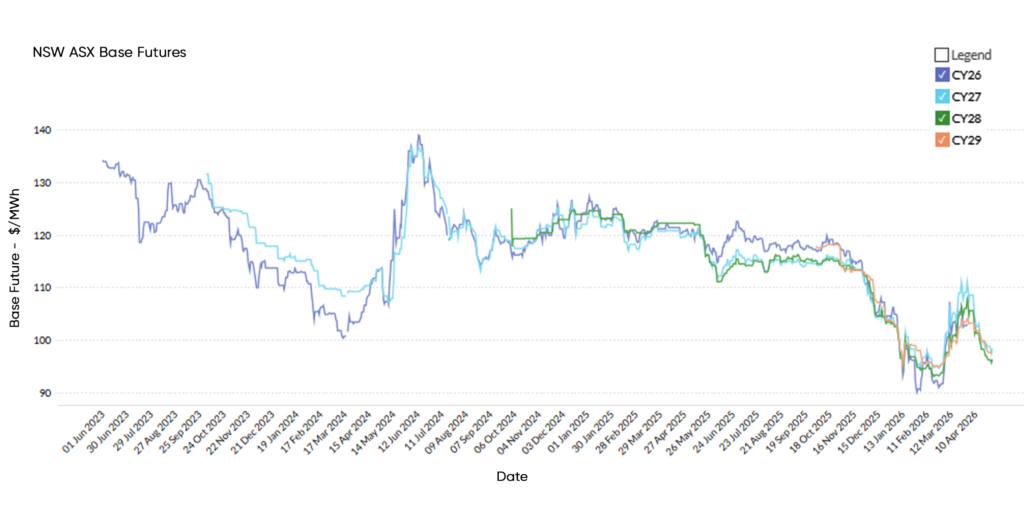
Futures
| Contract | Month Open | Month Close | % Change |
|---|---|---|---|
| CY27 | 95.58 | 111.12 | +16.3% |
| CY28 | 93.97 | 107.90 | -14.8% |
| CY29 | 95.60 | 104.15 | +9.0% |
Forward prices declined across the curve, with the largest reductions in CY27–28, indicating a broad softening in market expectations.
Generation Mix
| Metric | Apr-25 | Apr-26 | Change |
|---|---|---|---|
| Total generation (GWh) | 5,595 | 5,775 | +3.2% |
| Renewable share (%) | 35.1% | 36.7% | +1.6% |
| Coal share (%) | 54.7% | 53.3% | -1.4% |
| Gas share (%) | 2.3% | 0.3% | -2.0% |
| Emissions intensity (kgCO₂e/MWh) | 568 | 552 | -2.8% |
Queensland
Spot
QLD average spot prices declined to $53.31/MWh, down from $98.50/MWh (-45.9%).
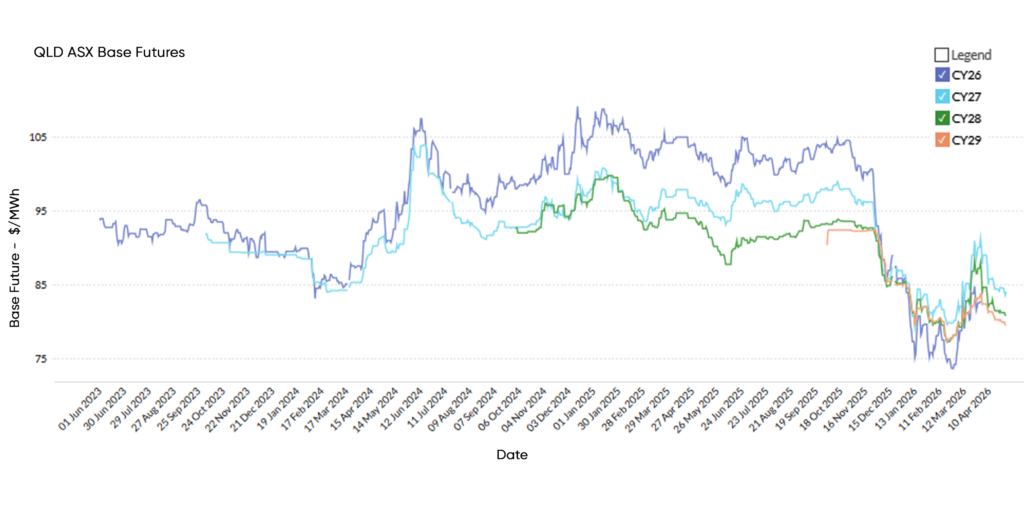
Futures
| Contract | Month Open | Month Close | % Change |
|---|---|---|---|
| CY27 | 90.22 | 84.05 | -6.8% |
| CY28 | 86.90 | 80.87 | -6.9% |
| CY29 | 83.71 | 79.54 | -5.0% |
Forward prices declined across all contracts, reflecting a moderate easing in forward expectations.
Generation Mix
| Metric | Apr-25 | Apr-26 | Change |
|---|---|---|---|
| Total generation (GWh) | 5,083 | 5,118 | +0.7% |
| Renewable share (%) | 30.9% | 40.2% | +9.3% |
| Coal share (%) | 66.9% | 60.1% | -6.8% |
| Gas share (%) | 5.3% | 3.2% | -2.1% |
| Emissions intensity (kgCO₂e/MWh) | 617 | 543 | -12.0% |
Victoria
Spot
VIC average spot prices declined to $35.68/MWh, down from $74.76/MWh (-52.3%), the largest reduction across the NEM.
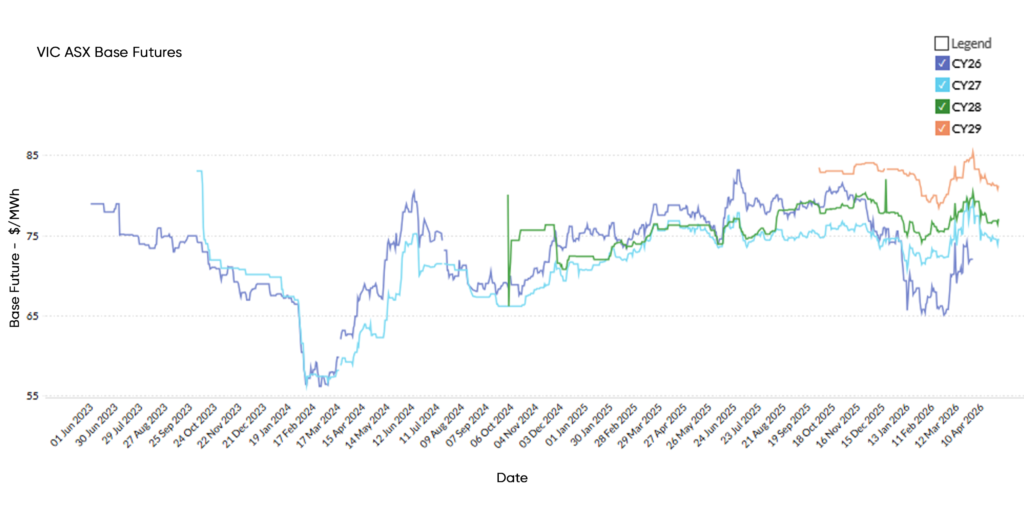
Futures
| Contract | Month Open | Month Close | % Change |
|---|---|---|---|
| CY27 | 78.24 | 74.65 | -4.6% |
| CY28 | 79.81 | 77.13 | -3.4% |
| CY29 | 84.90 | 81.27 | -4.3% |
Forward prices declined across all contracts, indicating a consistent softening in longer-term expectations.
Generation Mix
| Metric | Apr-25 | Apr-26 | Change |
|---|---|---|---|
| Total generation (GWh) | 3,751 | 3,918 | +4.5% |
| Renewable share (%) | 42.9% | 43.9% | +1.0% |
| Coal share (%) | 72.5% | 64.4% | -8.1% |
| Gas share (%) | 0.5% | 0.2% | -0.3% |
| Emissions intensity (kgCO₂e/MWh) | 720 | 695 | -3.5% |
South Australia
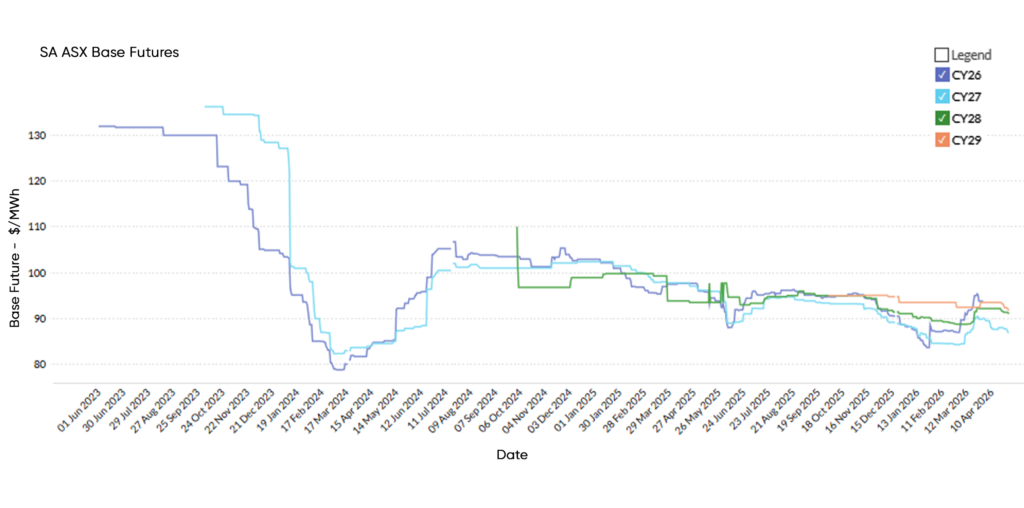
Spot
SA average spot prices declined to $56.18/MWh, down from $88.82/MWh (-36.7%).
Futures
| Contract | Month Open | Month Close | % Change |
|---|---|---|---|
| CY27 | 90.03 | 87.00 | -3.4% |
| CY28 | 92.18 | 91.02 | -1.3% |
| CY29 | 93.50 | 91.74 | -1.9% |
Forward prices eased slightly, indicating relatively stable longer-term expectations.
Generation Mix
| Metric | Apr-25 | Apr-26 | Change |
|---|---|---|---|
| Total generation (GWh) | 1,140 | 1,111 | -2.5% |
| Renewable share (%) | 59.2% | 66.5% | +7.3% |
| Gas share (%) | 21.5% | 13.2% | -8.3% |
| Emissions intensity (kgCO₂e/MWh) | 297 | 231 | -22.2% |
Closing Commentary
April reinforced the sustained shift in the National Electricity Market towards lower wholesale pricing, driven by continued growth in renewable generation and increasing participation from battery storage. These factors are reducing reliance on higher-cost thermal generation and supporting improved supply conditions across the market.
The softening of futures prices during the month indicates a degree of stabilisation in forward market expectations following recent volatility. While prices remain below long-term averages in most regions, the market continues to respond to evolving supply-demand dynamics and broader external influences.
As renewable penetration continues to rise, system constraints and curtailment are becoming increasingly important factors shaping market outcomes. This highlights the need for a proactive and informed approach to energy procurement.
Leading Edge Energy will continue to monitor market developments closely to support clients in navigating changing conditions and making confident, data-driven energy decisions.
Explainer: Why we focus on Wholesale Futures Prices
Wholesale Futures Price: This reflects what the market expects wholesale electricity spot rates to be in future periods. The offers that commercial and industrial (C&I) customers receive via Leading Edge Energy are closely correlated to wholesale prices on the ASX Energy futures market; this is why we focus on these prices in our commentary.
Spot Price: This represents how much the spot market is charging for electricity currently based on demand and supply. Spot prices go up when demand is high and supply is tight. You can view live Spot Prices here.
You can learn more about the difference between wholesale electricity futures and spot prices in our blog section.
Disclaimer: The information in this communication is for general information purposes only. It is not intended as financial or investment advice and should not be interpreted or relied upon as such.
We source, analyse, compare and rank commercial, industrial and multi-site energy quotes. Obligation Free.
Chat with one of our experienced consultants today and get the insights your business needs to help manage the risks associated with volatile electricity and natural gas markets. Our energy procurement service is obligation-free and provides a time-saving way of securing lower energy rates from our panel of energy retailers.
Get advice from our Energy Management Consultants

Ewen Beard
Sales Manager
Get in Touch
Feel free to call or e-mail us. Or just fill in the form below and we’ll contact you for an obligation-free discussion.
Are you ready to save on business energy costs?
Get StartedLeading Edge Energy is proud to be a signatory of the National Customer Code for Energy Brokers, Consultants and Retailers.