
January delivered broadly stable market conditions across the National Electricity Market (NEM), with spot prices easing across most regions compared to January 2025. Outcomes were supported by strong supply availability and continued growth in renewable generation, with renewables lifting their share of total generation to 49.1%, up 5.0 percentage points year-on-year.
Battery dispatch also continued to play an increasingly important role, with discharge volumes rising sharply from 70 GWh to 255 GWh, improving system flexibility during peak periods. Renewable curtailment increased year-on-year, reflecting continued periods of oversupply during daylight hours as renewable penetration continues to expand.
Futures markets responded in line with spot outcomes, trending lower across all major regions through the month. This shift indicates improving confidence in supply conditions and continued unwinding of summer risk premiums.
The sections below first summarise national market outcomes before stepping through state-by-state spot prices, futures movements and generation mix changes.
National Electricity Update
Spot Prices
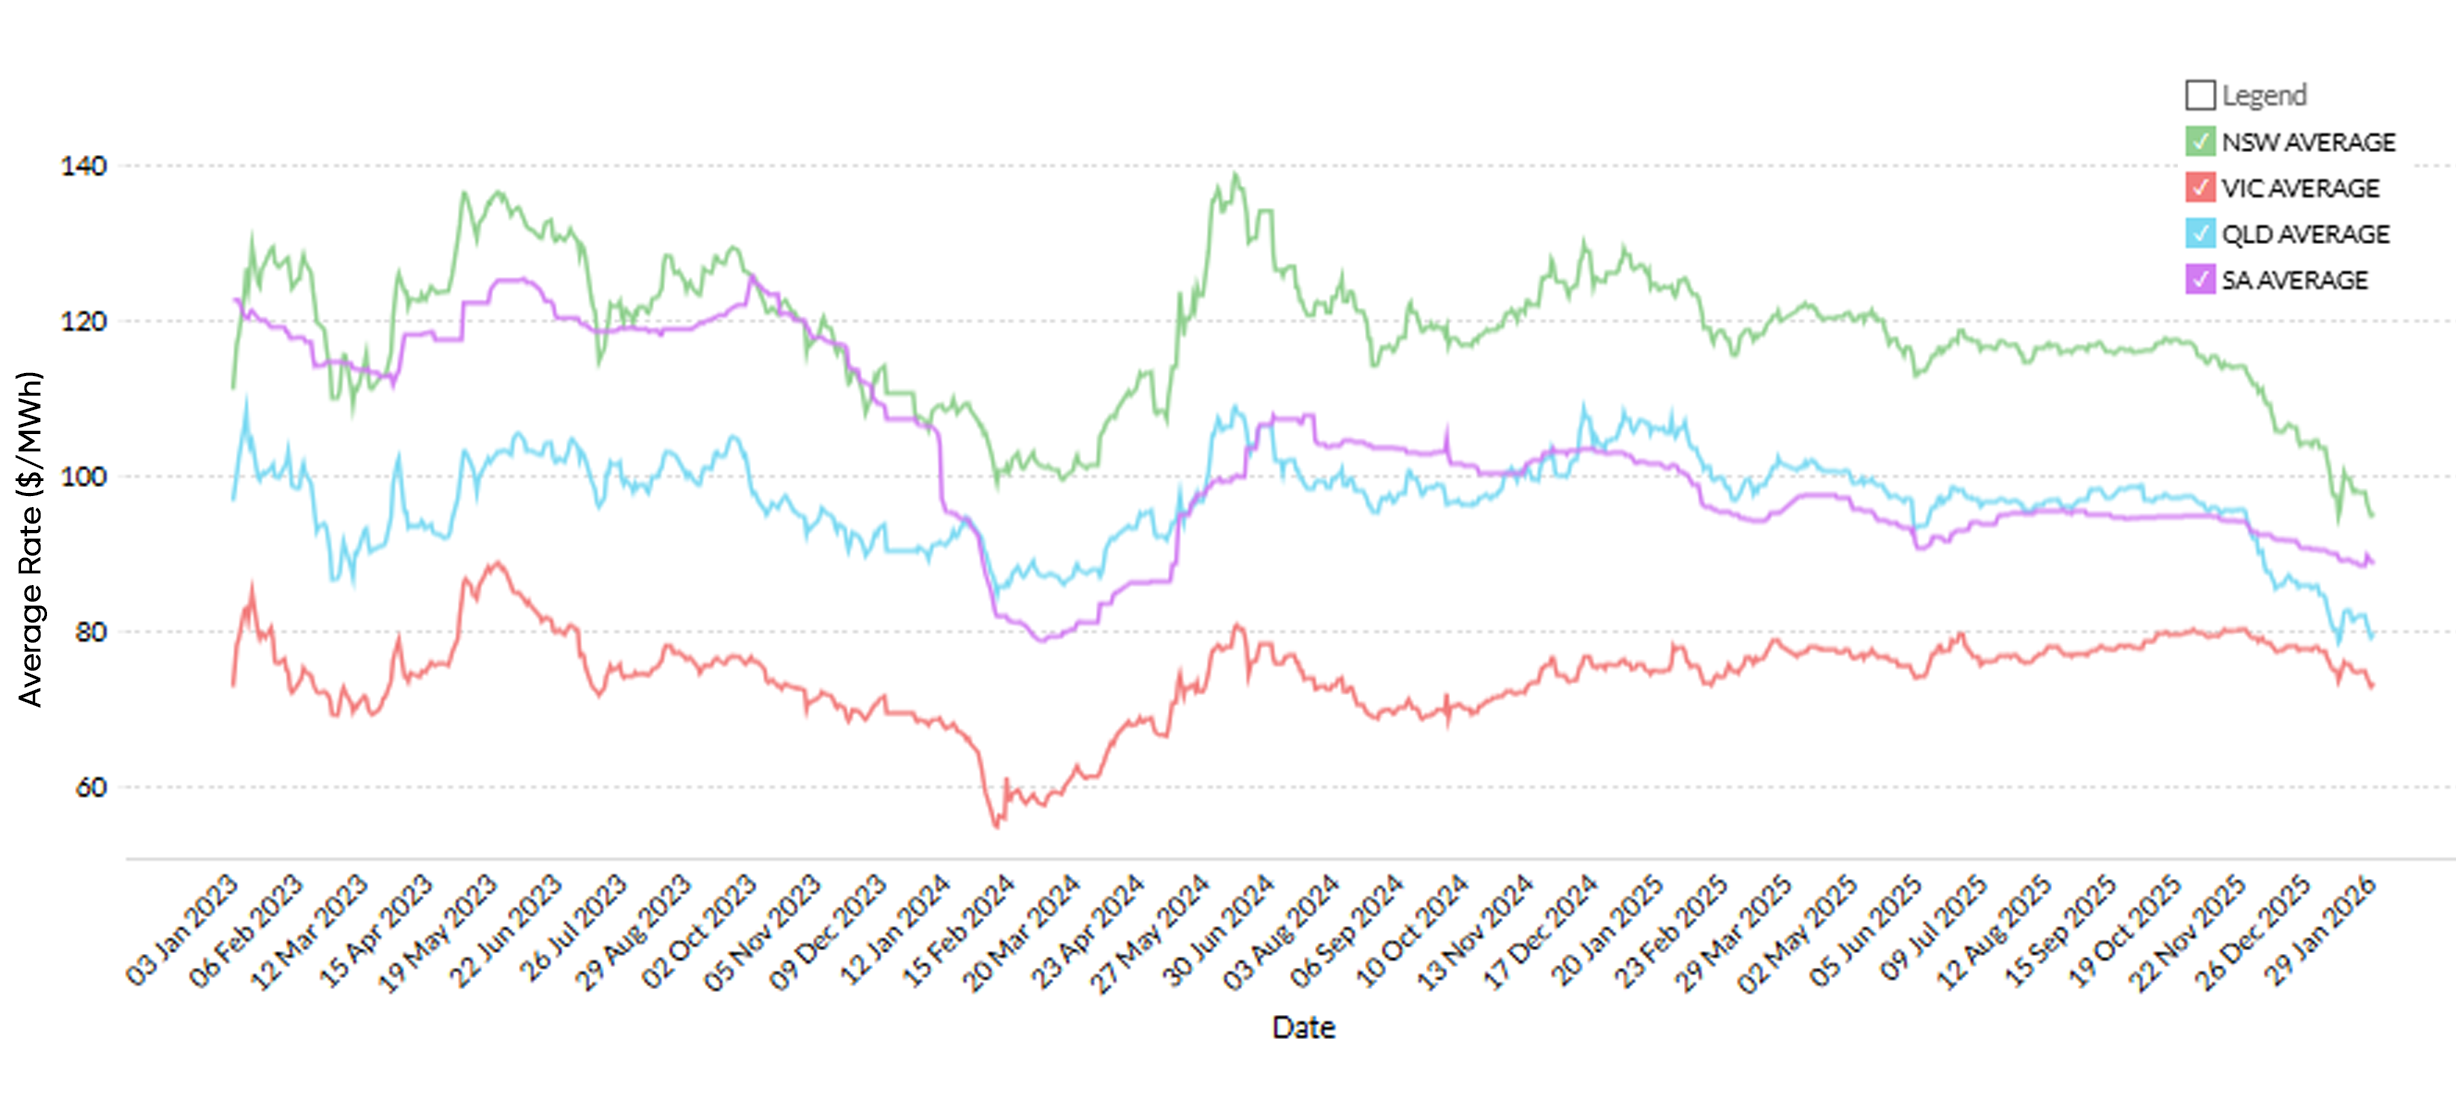
January delivered another month of generally subdued spot prices across the National Electricity Market (NEM), with outcomes easing materially year-on-year in NSW, QLD and VIC. These results reflect improving supply conditions across the grid, supported by higher renewable output and increased battery dispatch.
| Region | Jan-25 ($/MWh) | Jan-26 ($/MWh) | % Movement |
|---|---|---|---|
| NSW | 83.34 | 67.22 | -19.3% |
| QLD | 114.01 | 64.03 | -43.8% |
| SA | 48.22 | 152.25 | +215.7% |
| TAS | 113.63 | 100.93 | -11.2% |
| VIC | 48.35 | 38.55 | -20.3% |
| NEM Avg | 81.51 | 84.60 | +3.8% |
While demand rose modestly (+3.8% YoY), the NEM remained well supplied, with the generation mix continuing to shift toward renewables and storage:
- Renewable generation share increased by 5.0 percentage points, rising from 44.1% to 49.1%
- Battery discharge increased materially, from 70 GWh to 255 GWh
- Renewable curtailment rose from 580 GWh to 787 GWh, indicating continued periods of surplus generation
- Emissions intensity declined from 529 to 478 kgCO₂e/MWh (-9.6%)
Overall, these dynamics highlight a system increasingly supported by renewables and flexible dispatch, contributing to softer spot price outcomes across much of the NEM.
Future Prices
Futures markets softened through January, tracking weaker spot outcomes across most regions. At the close of the month, the NEM average fell to $84.00/MWh, down 6.2% from the month open.
Relative to the post-2023 average, futures prices remain notably lower across the curve, reflecting improving confidence in summer supply conditions and continued unwinding of residual risk premiums.
This continues to present an attractive window for businesses to review procurement strategy and consider securing forward contracts while pricing remains comparatively soft.
| January 2026 | Jan 2026 VS Jan 2023-Jan 2026 Average | ||||
|---|---|---|---|---|---|
| Region | Month Open | Month Close | % Movement | Avg Price Jan 2023 – Jan 2026 | % Movement |
| NSW | $104.33 | $94.87 | -9.1% | $118.13 | -19.7% |
| QLD | $85.68 | $79.37 | -7.4% | $96.86 | -18.1% |
| SA | $90.34 | $88.74 | -1.8% | $101.75 | -12.8% |
| VIC | $77.89 | $73.01 | -6.3% | $74.35 | -1.8% |
| NEM (Avg) | $89.56 | $84.00 | -6.2% | $97.77 | -14.1% |
Generation Mix
| Metric | Jan-25 | Jan-26 | YoY change |
|---|---|---|---|
| Total demand / generation (GWh) | 18,816 | 19,528 | +3.8% |
| Renewables share (%) | 44.1% | 49.1% | +5.0% |
| Coal share (%) | 52.0% | 47.2% | -4.8% |
| Gas share (%) | 3.5% | 2.4% | -1.1% |
| Battery discharge (GWh) | 70 | 255 | +264.3% |
| Renewables curtailment (GWh) | 580 | 787 | +35.7% |
| Emissions intensity (kgCO₂e/MWh) | 529 | 478 | -9.6% |
State Electricity Update
New South Wales
Spot
NSW average spot prices finished January 2026 at $67.22/MWh, down materially from $83.34/MWh in January 2025 (-19.3% YoY). This reflects improved supply conditions and a continued increase in renewable contribution.
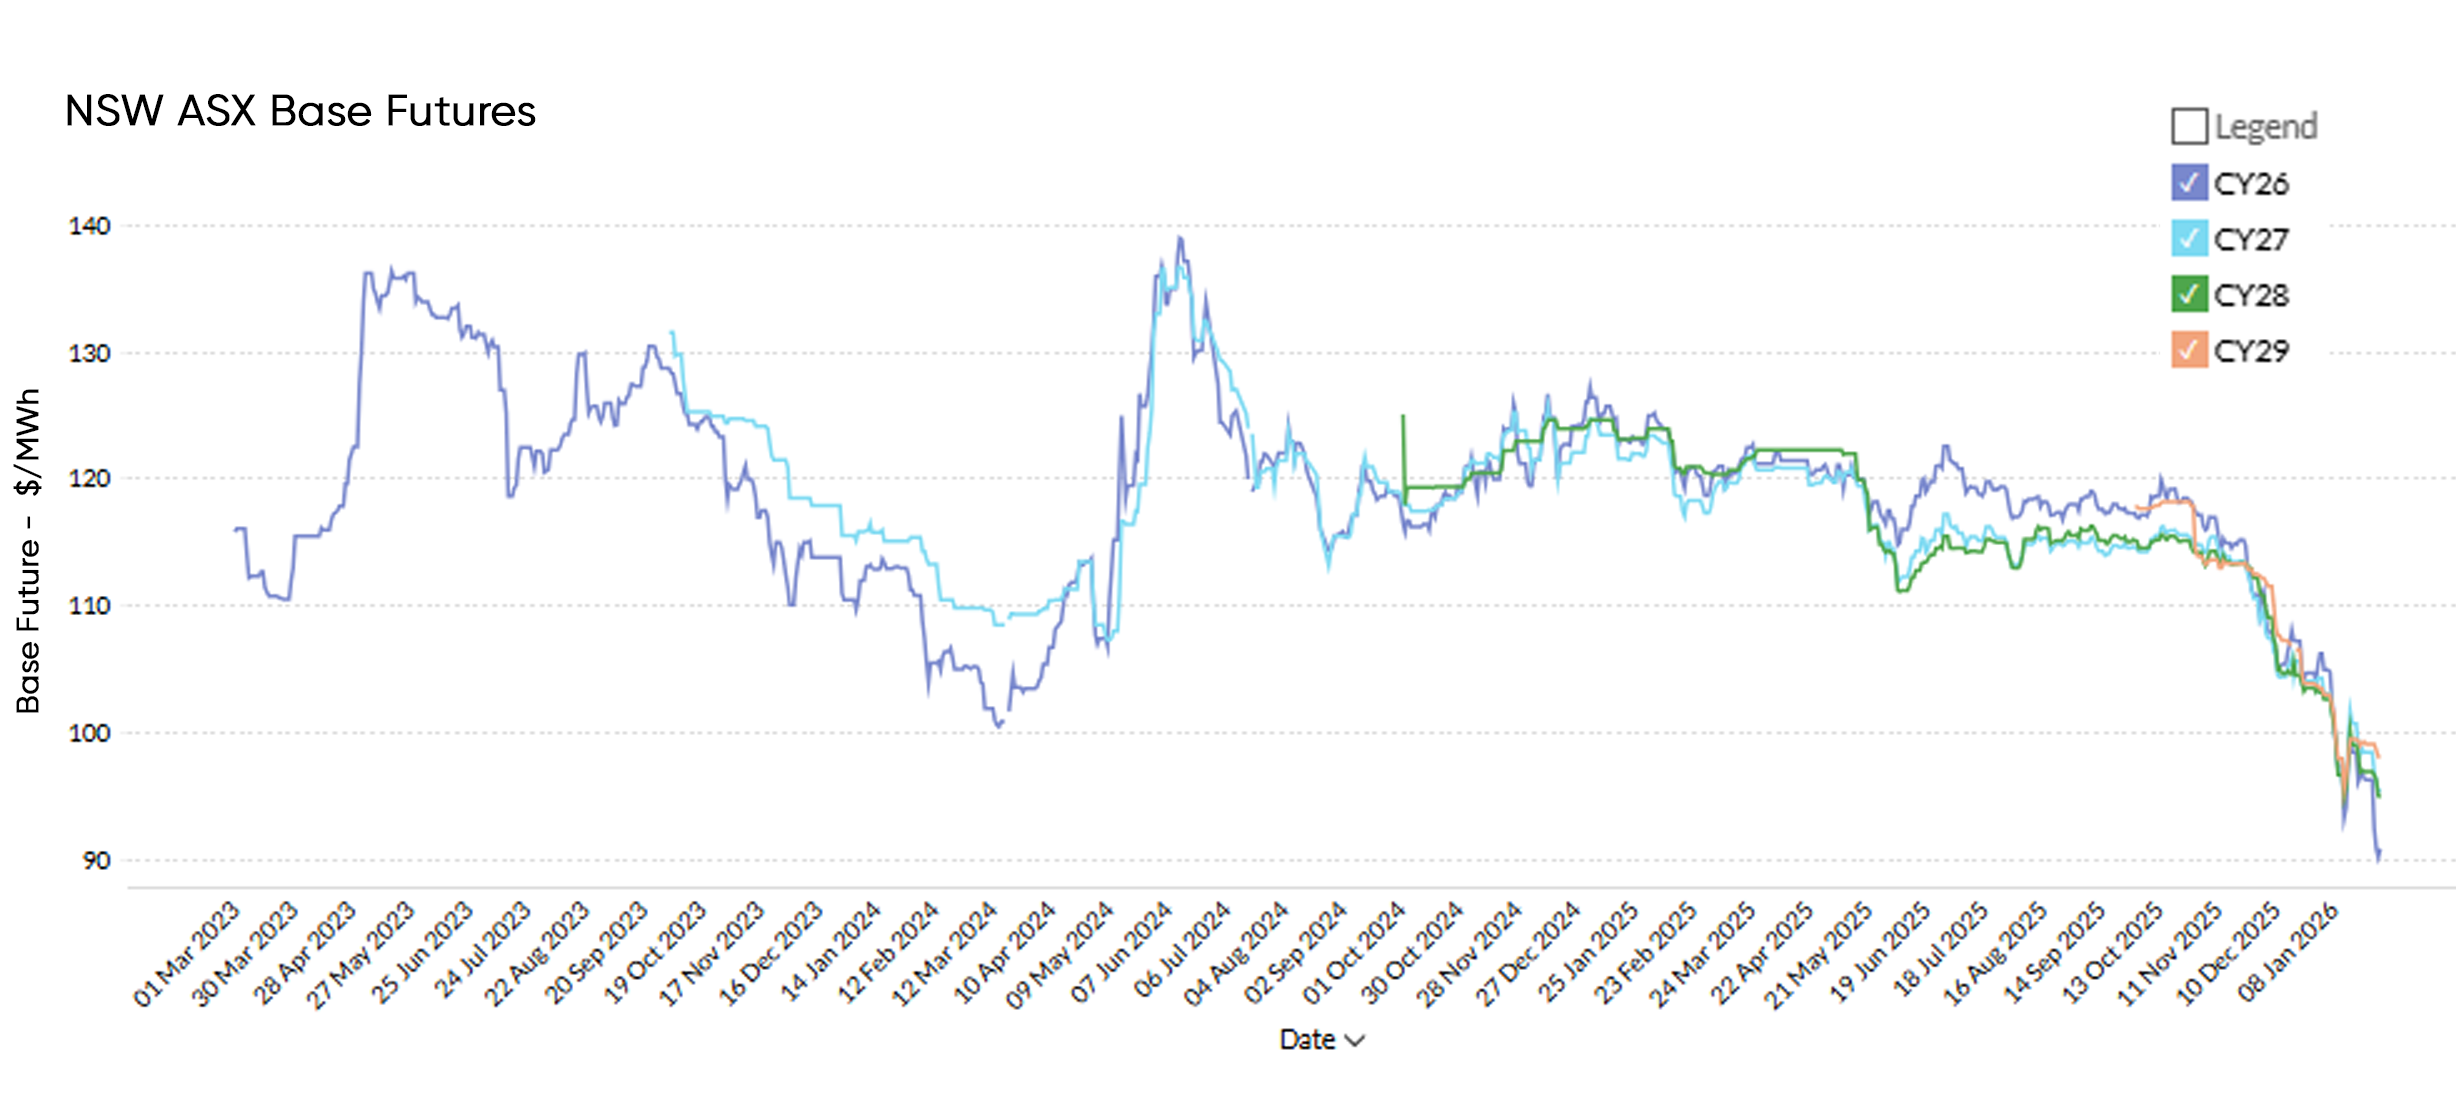
Futures
| Contract | Month Open | Month Close | % Change |
|---|---|---|---|
| CY26 | 106.28 | 90.88 | -14.5% |
| CY27 | 104.34 | 95.55 | -8.4% |
| CY28 | 103.20 | 94.90 | -8.0% |
| CY29 | 103.49 | 98.13 | -5.2% |
| NEM Avg | 104.33 | 94.87 | -9.1% |
Generation Mix
| Metric | Jan-25 | Jan-26 | YoY change |
|---|---|---|---|
| Total demand / generation (GWh) | 6,453 | 6,778 | +5.0% |
| Renewables share (%) | 41.9% | 45.2% | +3.3% |
| Coal share (%) | 56.7% | 49.8% | -6.9% |
| Gas share (%) | 1.3% | 1.1% | -0.2% |
| Battery discharge (GWh) | 16 | 55 | +243.8% |
| Renewables curtailment (GWh) | 117 | 223 | +90.6% |
| Imports (GWh) | 295 | 407 | +38.0% |
| Emissions intensity (kgCO₂e/MWh) | 530 | 492 | -7.2% |
Victoria
Spot
VIC spot prices remained subdued, finishing January 2026 at $38.55/MWh, down from $48.35/MWh in January 2025 (-20.3% YoY).
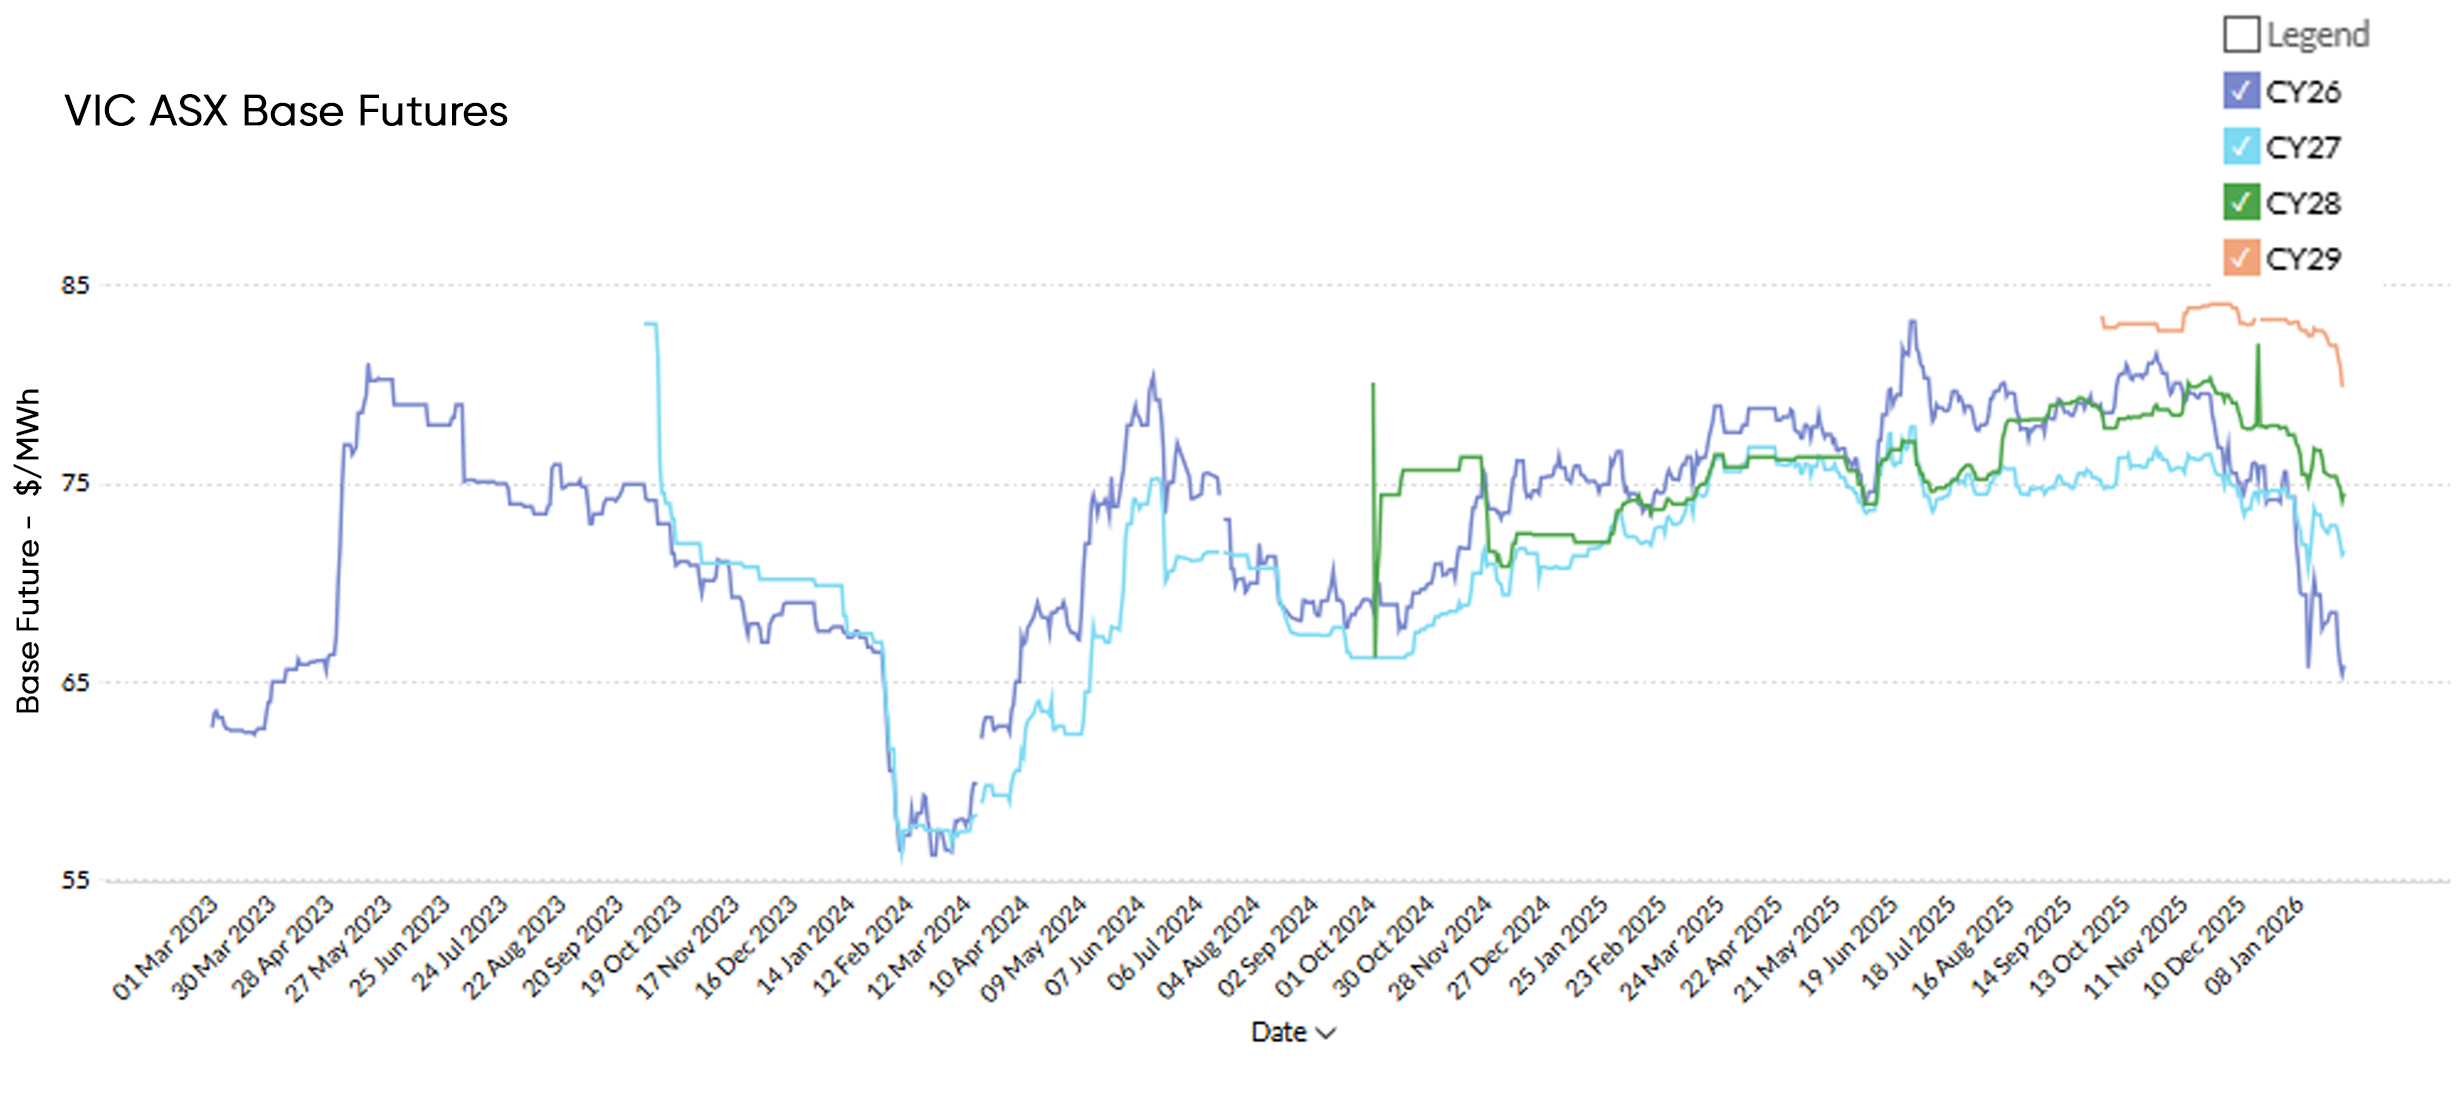
Futures
| Contract | Month Open | Month Close | % Change |
|---|---|---|---|
| CY26 | 75.60 | 65.85 | -12.9% |
| CY27 | 74.76 | 71.64 | -4.2% |
| CY28 | 77.87 | 74.56 | -4.3% |
| CY29 | 83.32 | 80.00 | -4.0% |
| NEM Avg | 77.89 | 73.01 | -6.3% |
Generation Mix
| Metric | Jan-25 | Jan-26 | YoY change |
|---|---|---|---|
| Total demand / generation (GWh) | 4,175 | 4,444 | +6.4% |
| Renewables share (%) | 49.5% | 52.8% | +3.3% |
| Coal share (%) | 58.6% | 53.9% | -4.7% |
| Gas share (%) | 0.9% | 1.0% | +0.1% |
| Battery discharge (GWh) | 23 | 67 | +191.3% |
| Renewables curtailment (GWh) | 178 | 370 | +107.9% |
| Imports (GWh) | 208 | 102 | -51.0% |
| Emissions intensity (kgCO₂e/MWh) | 610 | 581 | -4.8% |
Queensland
Spot
QLD recorded one of the largest reductions in spot pricing across the NEM. Average spot prices finished January 2026 at $64.03/MWh, down from $114.01/MWh in January 2025 (-43.8% YoY).
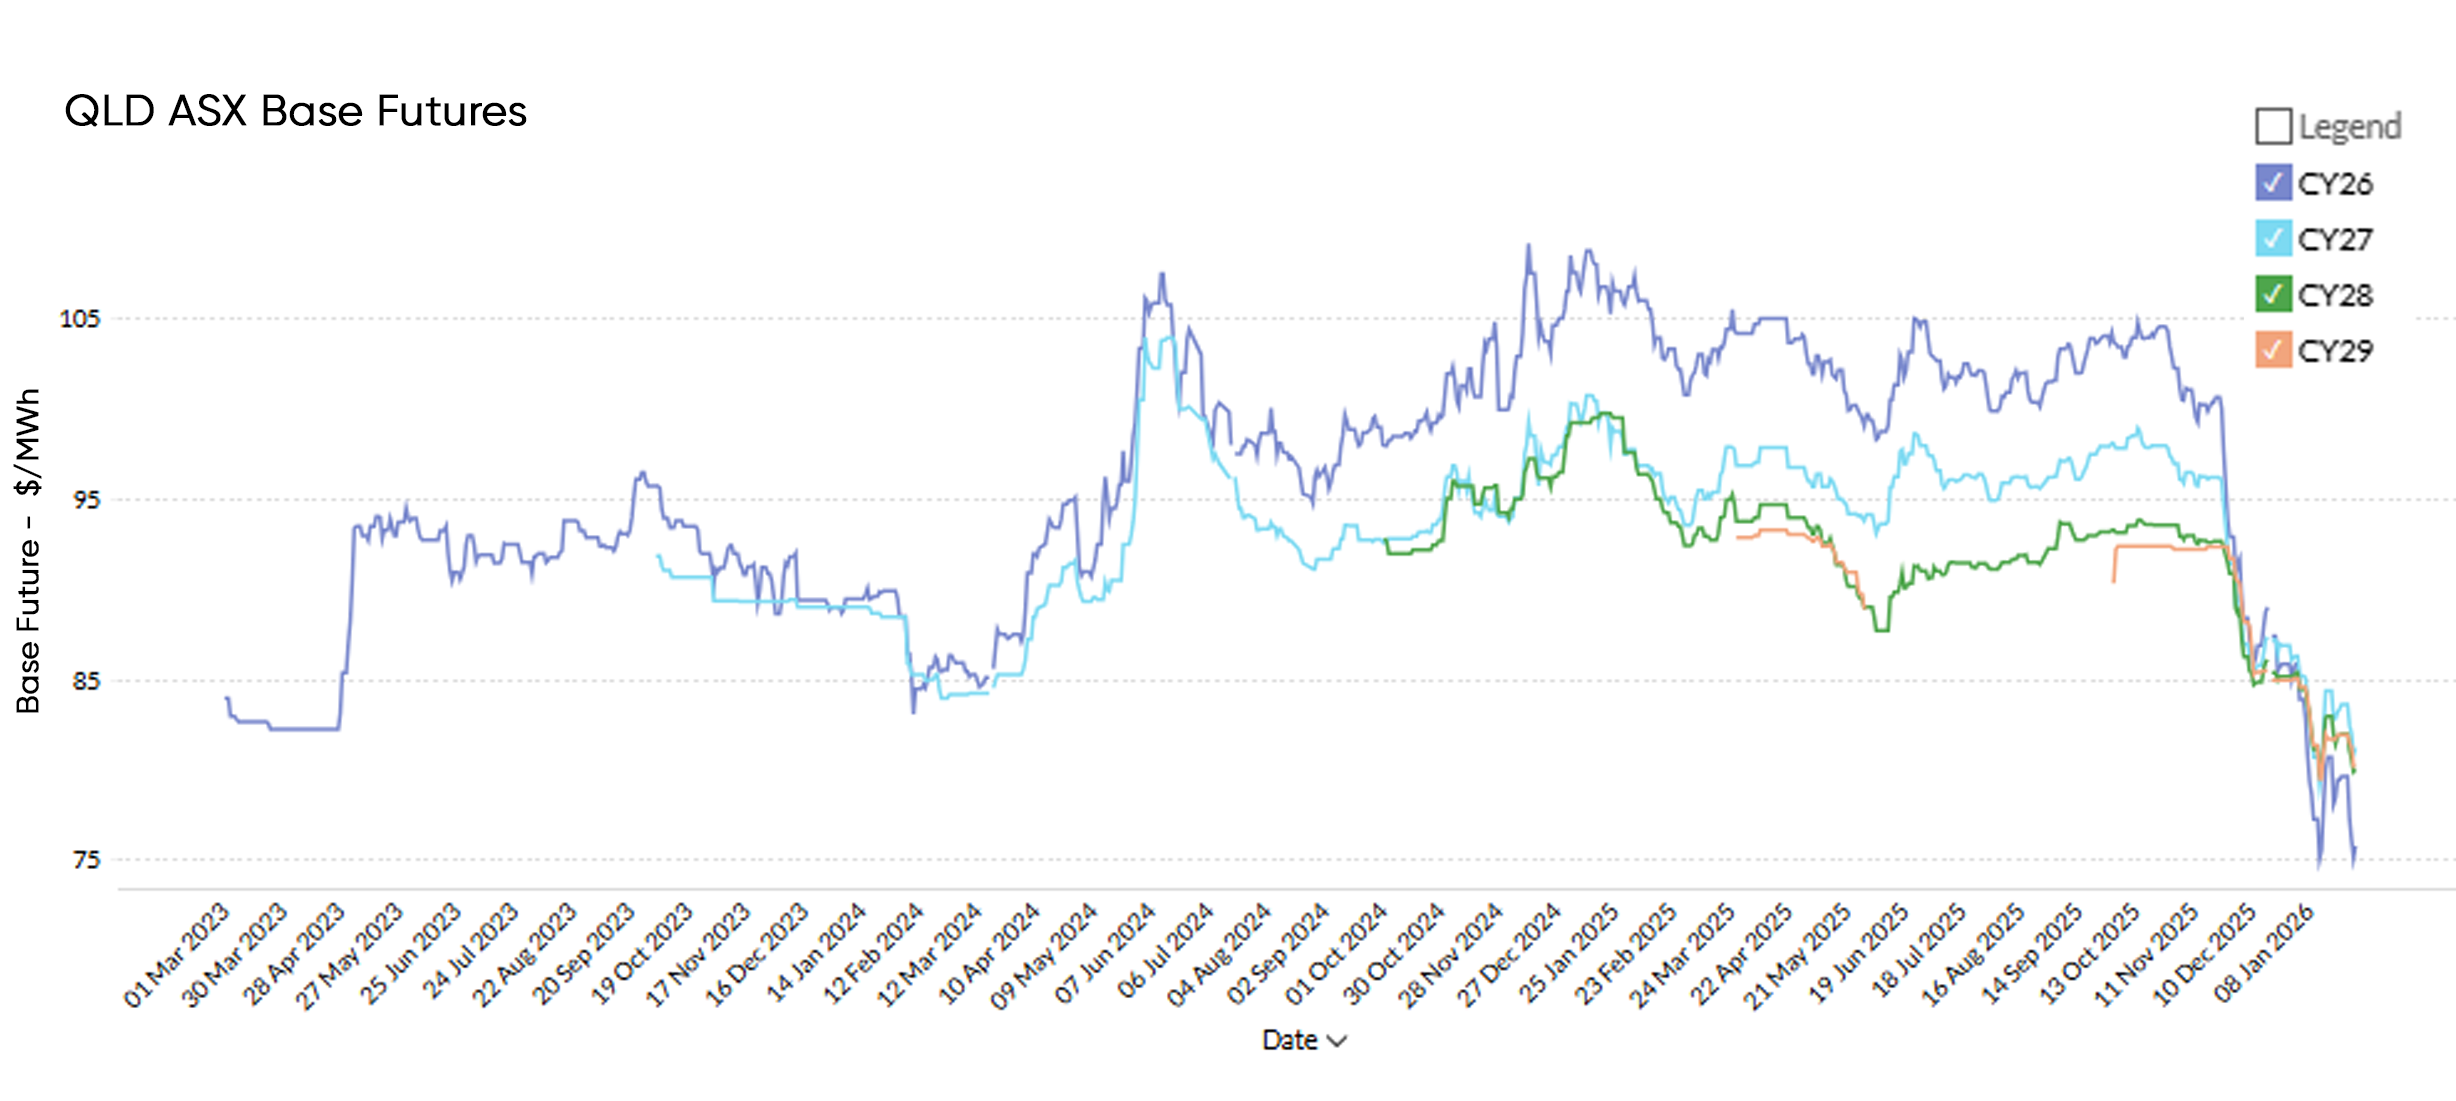
Futures
| Contract | Month Open | Month Close | % Change |
|---|---|---|---|
| CY26 | 85.89 | 75.84 | -11.7% |
| CY27 | 86.34 | 81.26 | -5.9% |
| CY28 | 85.40 | 80.06 | -6.3% |
| CY29 | 85.09 | 80.28 | -5.7% |
| NEM Avg | 85.68 | 79.37 | -7.4% |
Generation Mix
| Metric | Jan-25 | Jan-26 | YoY change |
|---|---|---|---|
| Total demand / generation (GWh) | 5,982 | 5,986 | +0.1% |
| Renewables share (%) | 31.9% | 38.2% | +6.3% |
| Coal share (%) | 61.4% | 57.3% | -4.1% |
| Gas share (%) | 5.6% | 3.2% | -2.4% |
| Battery discharge (GWh) | 16 | 77 | +381.3% |
| Renewables curtailment (GWh) | 66 | 21 | -68.2% |
| Imports (GWh) | 153 | 138 | -9.8% |
| Emissions intensity (kgCO₂e/MWh) | 591 | 539 | -8.8% |
South Australia
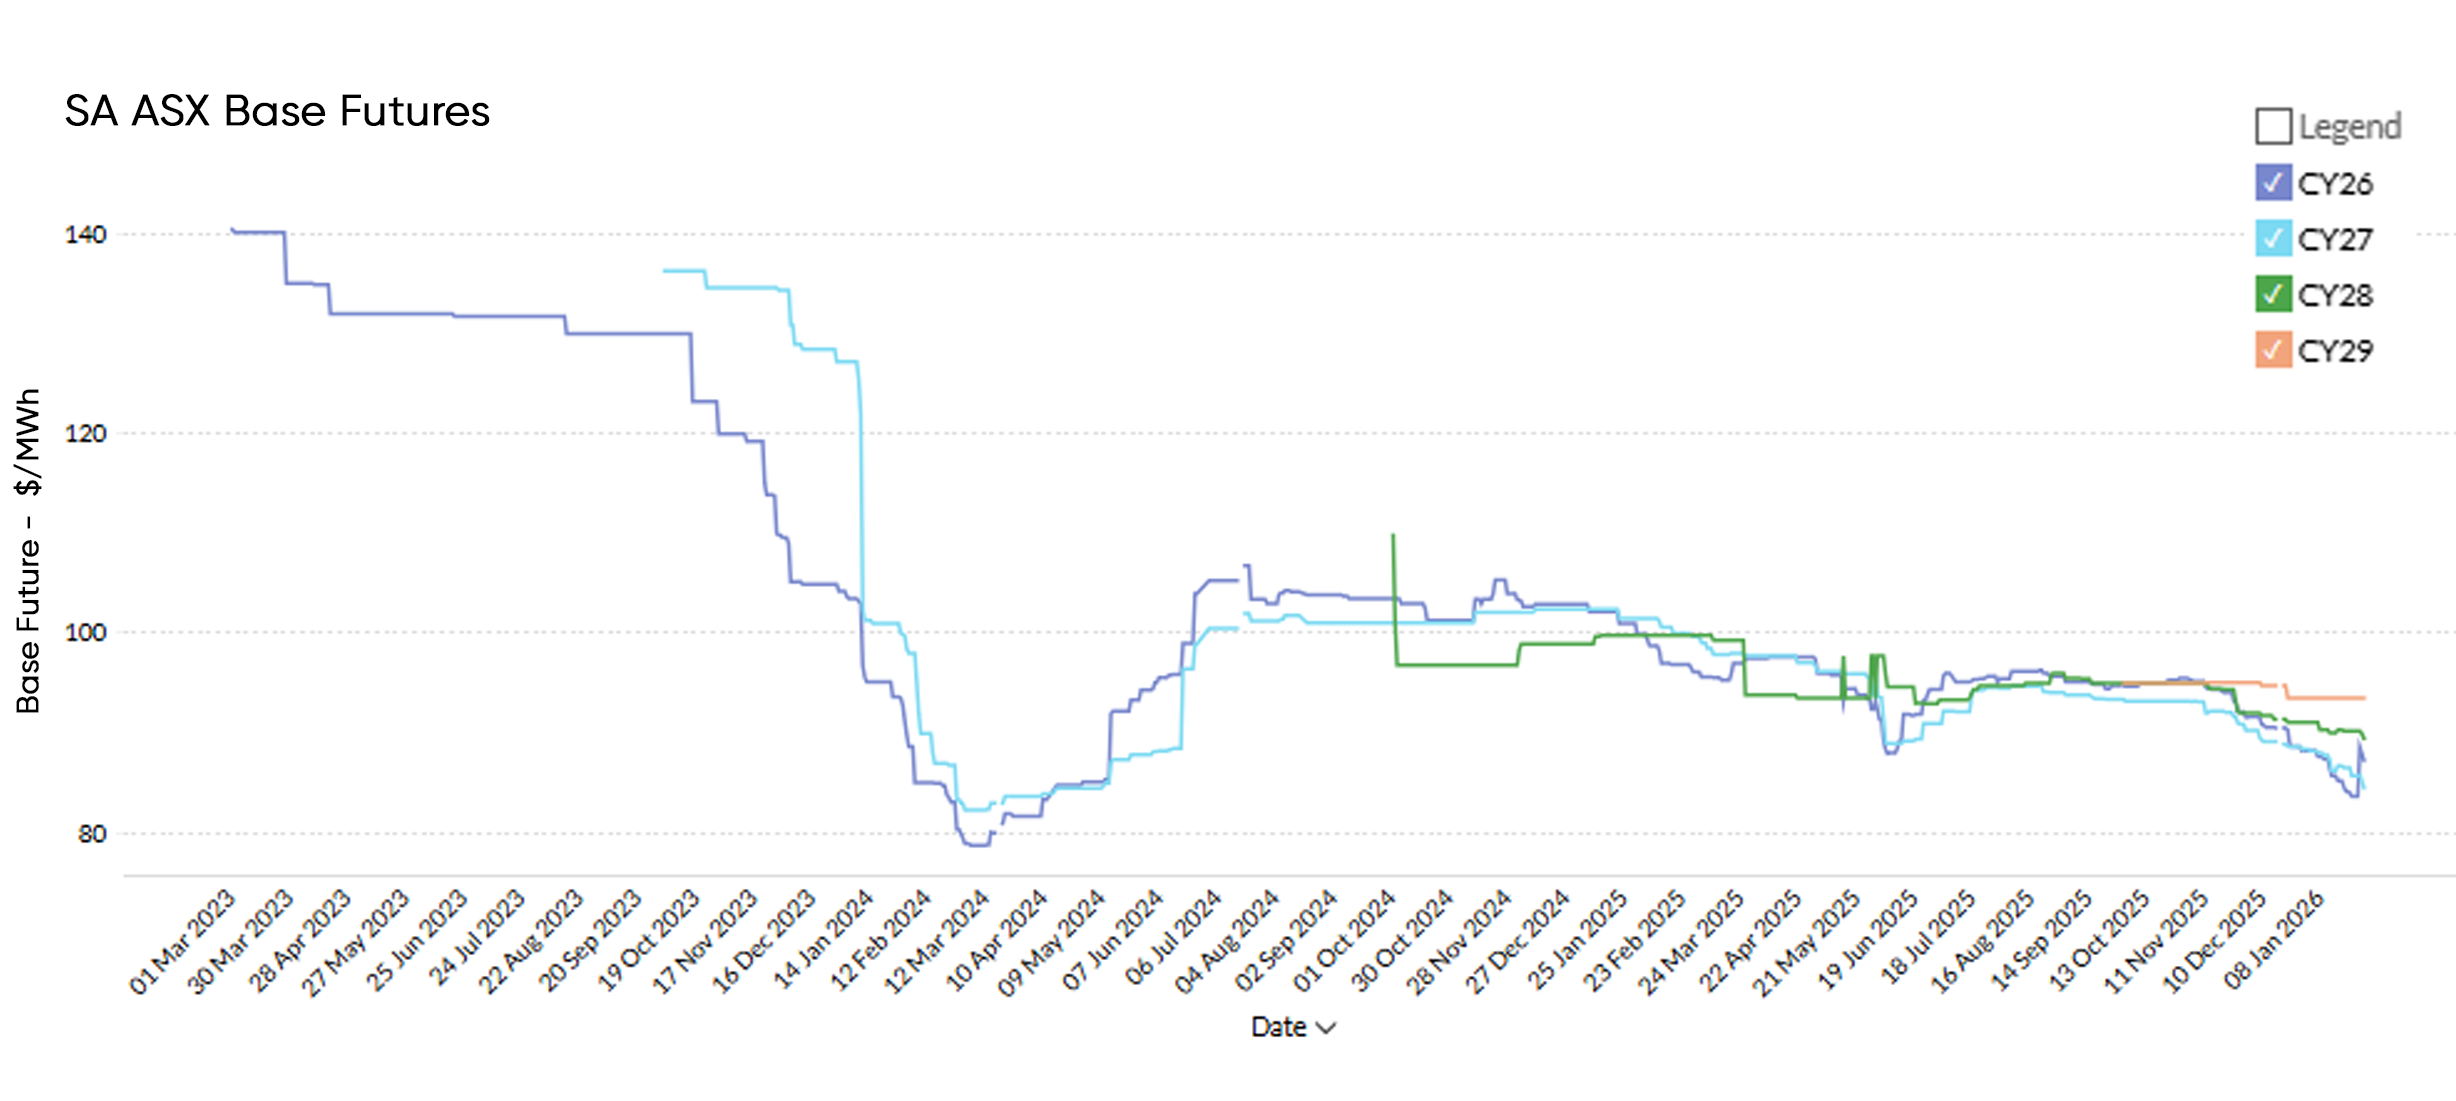
Spot
SA spot prices increased sharply year-on-year, highlighting that high-renewables systems can still experience significant volatility depending on regional constraints and interconnector conditions. Average spot prices finished January 2026 at $152.25/MWh, up from $48.22/MWh in January 2025 (+215.7% YoY).
Futures
| Contract | Month Open | Month Close | % Change |
|---|---|---|---|
| CY26 | 88.22 | 87.31 | -1.0% |
| CY27 | 88.46 | 84.59 | -4.4% |
| CY28 | 91.11 | 89.50 | -1.8% |
| CY29 | 93.53 | 93.53 | 0.0% |
| NEM Avg | 90.33 | 88.74 | -1.8% |
Generation Mix
| Metric | Jan-25 | Jan-26 | YoY change |
|---|---|---|---|
| Total demand / generation (GWh) | 1,370 | 1,494 | +9.1% |
| Renewables share (%) | 75.4% | 78.2% | +2.8% |
| Coal share (%) | 0.0% | 0.0% | 0.0% |
| Gas share (%) | 13.9% | 10.9% | -3.0% |
| Battery discharge (GWh) | 15 | 37 | +146.7% |
| Renewables curtailment (GWh) | 185 | 200 | +8.1% |
| Imports (GWh) | 182 | 167 | -8.2% |
| Emissions intensity (kgCO₂e/MWh) | 174 | 140 | -19.5% |
Closing Commentary
January reinforced the ongoing transition of the NEM, with renewables continuing to increase market share, emissions intensity declining, and batteries playing a growing role in supporting peak demand. While most regions experienced softer pricing outcomes, volatility in South Australia highlighted that constraint-driven price risk remains a key feature of high-renewables systems.
Leading Edge Energy continues to monitor spot and futures conditions closely and will provide ongoing updates to support clients with procurement strategy, risk management and contract optimisation.
Explainer: Why we focus on Wholesale Futures Prices
Futures Price: This reflects what the market expects wholesale electricity spot rates to be in future periods. The offers that commercial and industrial (C&I) customers receive via Leading Edge Energy are closely correlated to wholesale prices on the ASX Energy futures market; this is why we focus on these prices in our commentary.
Wholesale Spot Price: This represents how much the spot market is charging for electricity currently based on demand and supply. Spot prices go up when demand is high and supply is tight.
You can learn more about the difference between wholesale electricity futures and spot prices in our blog section.
Disclaimer: The information in this communication is for general information purposes only. It is not intended as financial or investment advice and should not be interpreted or relied upon as such.
We source, analyse, compare and rank commercial, industrial and multi-site energy We source, analyse, compare and rank commercial, industrial and multi-site energy quotes. Obligation Free.
Chat with one of our experienced consultants today and get the insights your business needs to help manage the risks associated with volatile electricity and natural gas markets. Our energy procurement service is obligation-free and provides a time-saving way of securing lower energy rates from our panel of energy retailers.
Get advice from our Energy Management Consultants

Ewen Beard
Sales Manager
Get in Touch
Feel free to call or e-mail us. Or just fill in the form below and we’ll contact you for an obligation-free discussion.
Are you ready to save on business energy costs?
Get StartedLeading Edge Energy is proud to be a signatory of the National Customer Code for Energy Brokers, Consultants and Retailers.