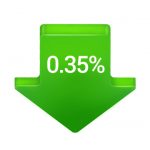
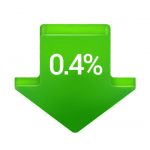
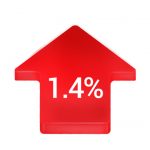
Electricity rates: Futures prices dropped slightly in all states under review in November apart from South Australia. The biggest drop was experienced in Queensland with 2%, followed by Victoria and New South Wales with 0.4%. South Australia experienced a jump of 1.4%. The average drop in futures prices across the board was of 0.35%. Prices are still up by between 34% and 161% when compared to 24 months ago. Futures prices have increased in all states under review apart from Queensland since the Government announced the National Energy Guarantee on 16 October.The average increase across the board to date was of 1.87%.
All states electricity average
| Futures Price Movement since: | Current Month to Date | Last month to Date | 3 Months to Date | 6 Months to Date | 12 Months to Date | 24 Months to Date |
| 1 Dec 2017 | 1 Nov 2017 | 1 Oct 2017 | 1 Jul 2017 | 1 Jan 2017 | 1 Jan 2016 | |
| NSW – Average | No change | Down 0.40% | Down 0.36% | Up 10.86% | Up 24.85% | Up 97.31% |
| QLD – Average | No change | Down 2.04% | Down 0.35% | Up 1.56% | Up 2.01% | Up 34.17% |
| SA – Average | No change | Up 1.43% | Up 1.64% | Down 2.23% | Up 5.28% | Up 42.96% |
| VIC – Average | Down 0.03% | Down 0.41% | Down 0.01% | Up 5.67% | Up 42.04% | Up 161.27% |
Source: www.asxenergy.com.au
Note: The above rates are based on the average of Calendar Year 2018, 2019, 2020 baseload futures prices.
 NSW electricity rates update
| Futures Price Movement since: | Current Month to Date | Last month to Date | 3 Months to Date | 6 Months to Date | 12 Months to Date | 24 Months to Date |
| 1 Dec 2017 | 1 Nov 2017 | 1 Oct 2017 | 1 Jul 2017 | 1 Jan 2017 | 1 Jan 2016 | |
| NSW – Average | No change | Down 0.40% | Down 0.36% | Up 10.86% | Up 24.85% | Up 97.31% |
Wholesale futures prices in NSW trended down slightly in November with an average total drop of 0.4%. This is reflected in the rates that are currently being offered by retailers to large market electricity customers in NSW.
 Queensland electricity rates update
| Futures Price Movement since: | Current Month to Date | Last month to Date | 3 Months to Date | 6 Months to Date | 12 Months to Date | 24 Months to Date |
| 1 Dec 2017 | 1 Nov 2017 | 1 Oct 2017 | 1 Jul 2017 | 1 Jan 2017 | 1 Jan 2016 | |
| QLD – Average | No change | Down 2.04% | Down 0.35% | Up 1.56% | Up 2.01% | Up 34.17% |
Wholesale futures prices in Queensland dipped in November with an average total drop of 2%. This is reflected in the rates that are currently being offered by retailers to large market electricity customers in Queensland.
 South Australia electricity rates update
| Futures Price Movement since: | Current Month to Date | Last month to Date | 3 Months to Date | 6 Months to Date | 12 Months to Date | 24 Months to Date |
| 1 Dec 2017 | 1 Nov 2017 | 1 Oct 2017 | 1 Jul 2017 | 1 Jan 2017 | 1 Jan 2016 | |
| SA – Average | No change | Up 1.43% | Up 1.64% | Down 2.23% | Up 5.28% | Up 42.96% |
Wholesale futures prices in South Australia were up slightly in November with an average total increase of 1.4%. This is reflected in the rates that are currently being offered by retailers to large market electricity customers in South Australia.
 Victoria electricity rates update
| Futures Price Movement since: | Current Month to Date | Last month to Date | 3 Months to Date | 6 Months to Date | 12 Months to Date | 24 Months to Date |
| 1 Dec 2017 | 1 Nov 2017 | 1 Oct 2017 | 1 Jul 2017 | 1 Jan 2017 | 1 Jan 2016 | |
| VIC – Average | Down 0.03% | Down 0.41% | Down 0.01% | Up 5.67% | Up 42.04% | Up 161.27% |
Wholesale futures prices in Victoria dropped slightly in November with an average total of 0.4%. This is reflected in the rates that are currently being offered by retailers to large market electricity customers in Victoria.
 NSW electricity rates update
 Queensland electricity rates update
 South Australia electricity rates update


