
February delivered another month of relatively subdued electricity pricing across the National Electricity Market (NEM). Key market developments during the month included:
• NEM spot prices fell 22.8% compared with February 2025, with the largest reductions occurring in South Australia and Victoria.
• Renewable penetration increased to 46.4% of NEM generation, up from 43.9% in February 2025, while both coal and gas generation shares declined.
• Battery discharge reached 244 GWh, an increase of more than 260% compared with February 2025, highlighting the growing role of storage in supporting system flexibility.
• Forward electricity prices at the end of February remained around 15% below their average levels since January 2023, reflecting improved supply conditions across the market.
These outcomes reflect continued growth in renewable generation across the NEM and the increasing role of battery storage in balancing variable supply. Strong solar and wind output across several regions helped suppress sustained high-price periods and reduced reliance on gas generation during peak demand intervals.
Middle East Conflict
While February results point to relatively stable market conditions, volatility increased shortly after the month closed. In early March, escalating geopolitical tensions in the Middle East triggered sharp movements across global energy markets, particularly oil and LNG prices. These developments quickly flowed through to Australian energy markets, driving increased volatility in forward electricity contracts as market participants reassessed fuel cost expectations and broader supply risks.
The sections below summarise national market outcomes for February before stepping through each state’s spot prices, futures movements and generation mix.
National Electricity Update
Spot Prices
Spot prices across the NEM were materially lower in February compared with the same month in 2025, with most regions experiencing reduced average wholesale prices. Strong renewable generation and reduced gas dispatch helped limit sustained high-price events across the month.
| Region | Feb-25 ($/MWh) | Feb-26 ($/MWh) | % Movement |
|---|---|---|---|
| NSW | 90.33 | 83.76 | -7.3% |
| QLD | 74.91 | 69.87 | -6.7% |
| SA | 91.34 | 56.00 | -38.7% |
| TAS | 121.69 | 90.28 | -25.8% |
| VIC | 68.55 | 45.06 | -34.3% |
| NEM Avg | 89.36 | 69.00 | -22.8% |
Victoria and South Australia experienced the largest reductions in wholesale pricing, supported by strong renewable output and reduced reliance on gas generation. Queensland and New South Wales also recorded lower prices, although declines were more moderate.
Futures Prices
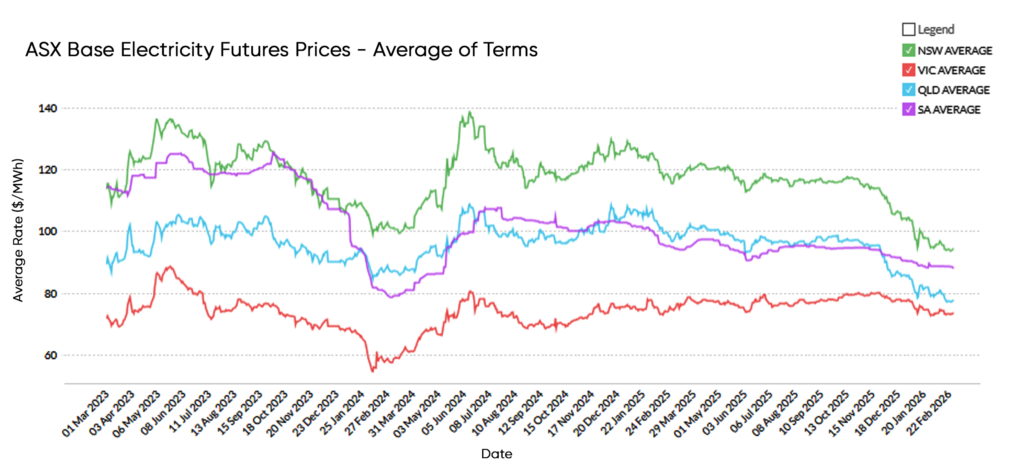
Electricity futures prices moved only modestly during February, reflecting the relatively stable spot market conditions observed throughout the month.
| Region | Month Open | Month Close | Jan-23 – Feb26 Avg | % movement | Movement vs LT Avg |
| NSW | 97.27 | 96.84 | 118.64 | -0.4% | -18.4% |
| QLD | 78.36 | 77.14 | 97.25 | -1.6% | -20.7% |
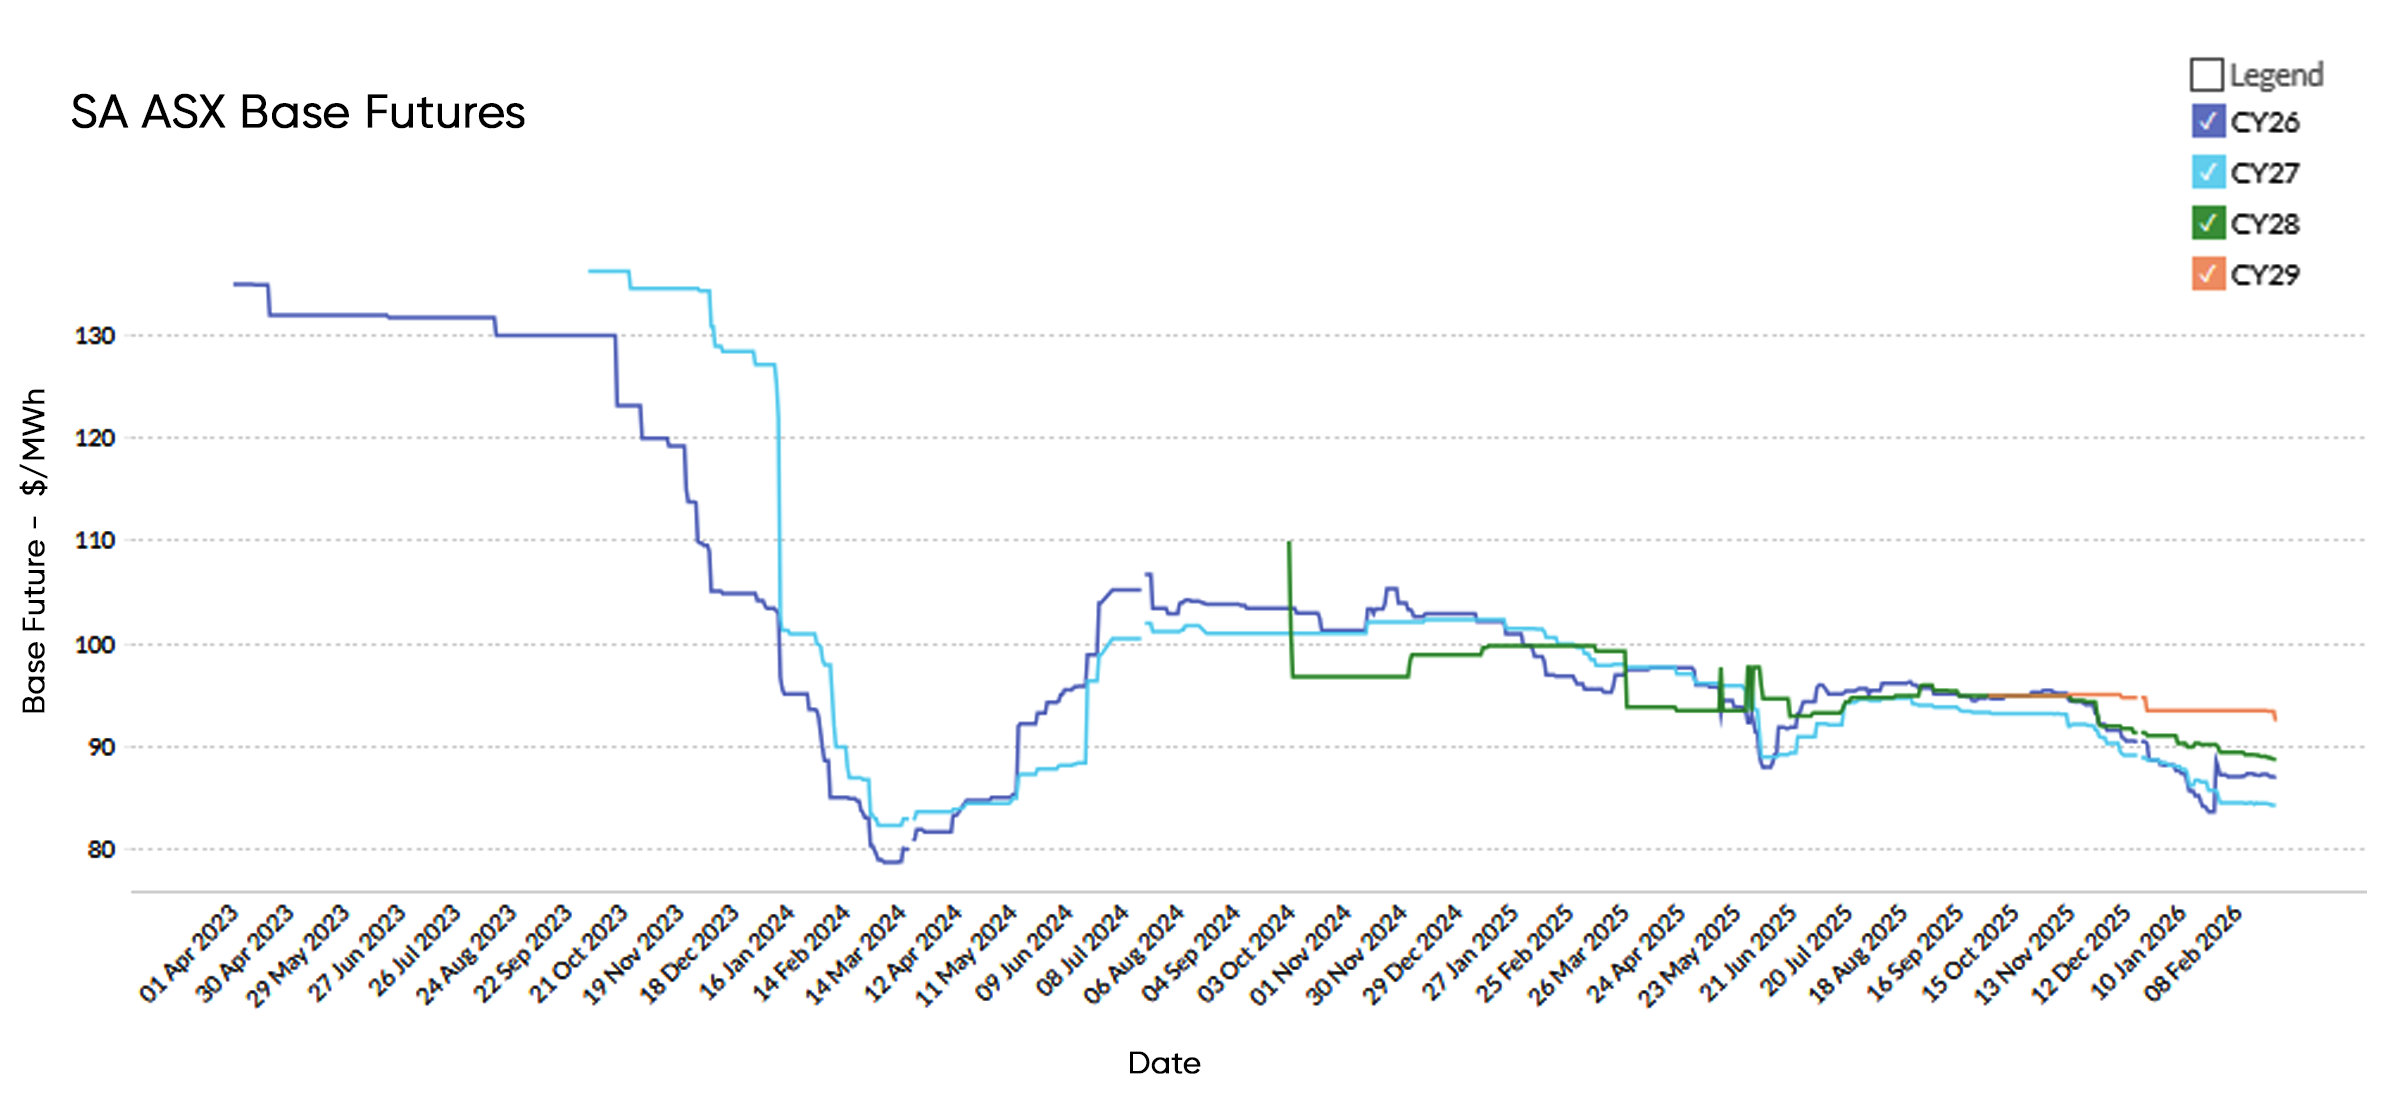
| SA | 87.73 | 87.15 | 102.06 | -0.7% | -14.6% |
| VIC | 73.01 | 73.56 | 74.35 | +0.8% | -1.1% |
| NEM (Avg) | 84.59 | 83.67 | 98.07 | -1.1% | -14.7% |
Forward electricity prices remain materially below the long-term averages observed since the 2022 energy crisis, reflecting improving generation availability and continued growth in renewable capacity across the market.
Generation Mix
Renewable generation continued to grow across the NEM in February, contributing to lower emissions intensity and reduced reliance on gas generation.
| Metric | Feb-25 | Feb-26 | Change |
|---|---|---|---|
| Total generation (GWh) | 17,428 | 17,591 | +0.9% |
| Renewable share (%) | 43.9% | 46.4% | +2.5 % |
| Coal share (%) | 52.3% | 49.4% | -2.9 % |
| Gas share (%) | 4.2% | 2.8% | -1.4% |
| Battery discharge (GWh) | 67 | 244 | +264% |
| Renewable curtailment (GWh) | 475 | 478 | +0.6% |
| Emissions intensity (kgCO₂e/MWh) | 560 | 504 | -10.0% |
The increase in renewable penetration was supported by strong solar and wind output across several regions. Battery discharge also increased significantly year-on-year as more storage assets participated in the market.
State Electricity Update
New South Wales
Spot
NSW average spot prices declined modestly in February, falling from $90.33/MWh to $83.76/MWh (-7.3%). Improved renewable generation and reduced gas dispatch limited sustained high-price intervals during the month.
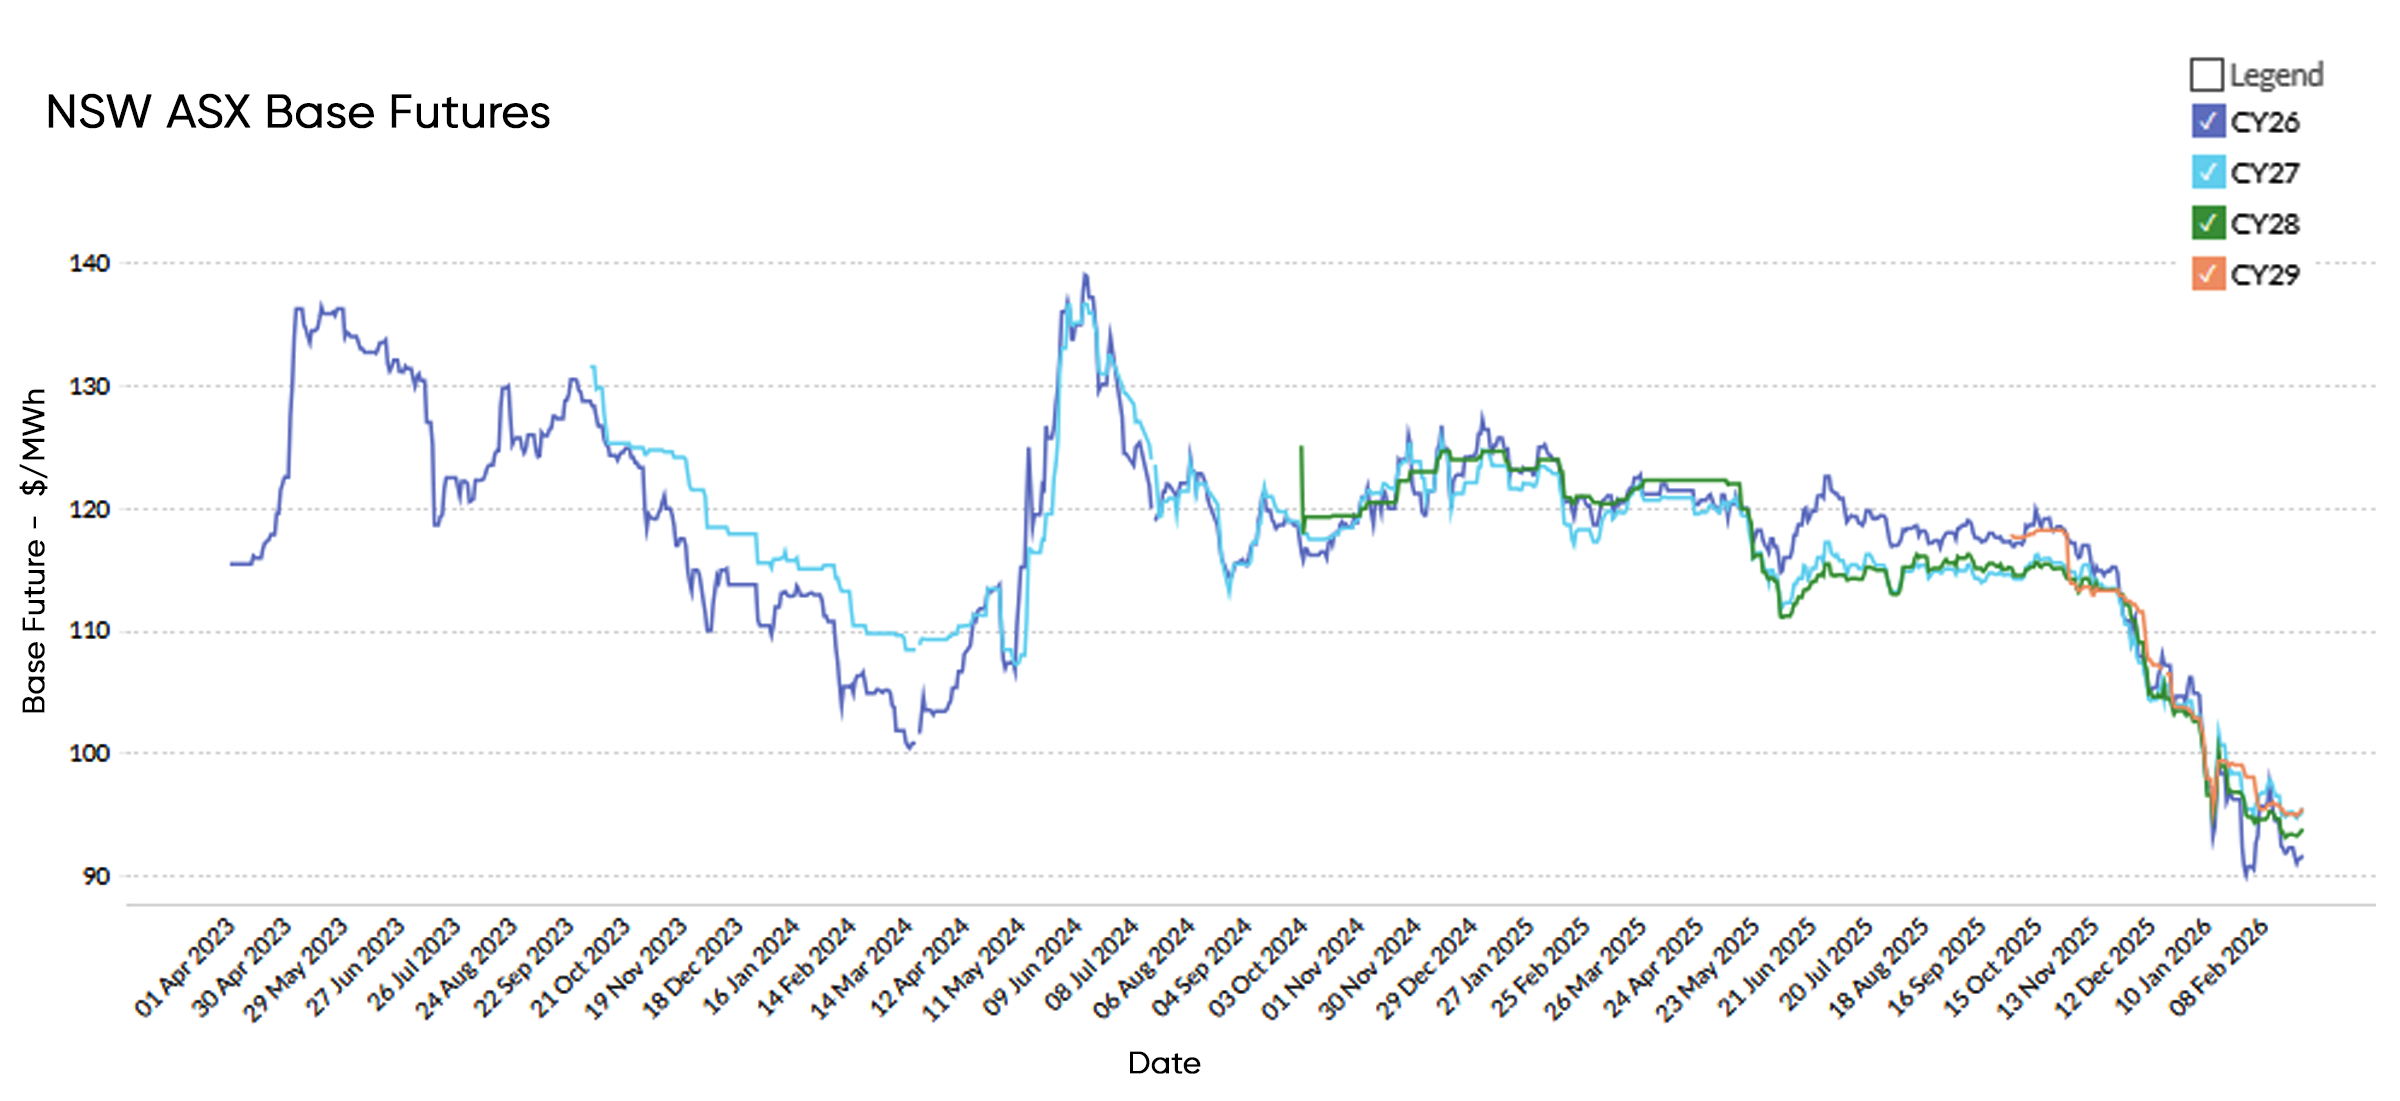
Futures
| Contract | Month Open | Month Close | % Change |
|---|---|---|---|
| CY26 | 90.88 | 91.82 | +1.0% |
| CY27 | 95.55 | 95.58 | 0.0% |
| CY28 | 94.90 | 93.97 | -1.0% |
| CY29 | 98.13 | 95.60 | -2.6% |
Generation Mix
| Metric | Feb-25 | Feb-26 | Change |
|---|---|---|---|
| Total generation (GWh) | 6,036 | 6,267 | +3.8% |
| Renewable share (%) | 39.6% | 39.4% | -0.2% |
| Coal share (%) | 55.6% | 53.3% | -2.3% |
| Gas share (%) | 1.4% | 1.2% | -0.2% |
| Battery discharge (GWh) | 10.4 | 59 | +467% |
| Renewable curtailment (GWh) | 142 | 143 | +0.7% |
| Emissions intensity (kgCO₂e/MWh) | 541 | 534 | -1.3% |
Queensland
Spot
Queensland spot prices averaged $69.87/MWh in February, compared with $74.91/MWh in February 2025 (-6.7%).
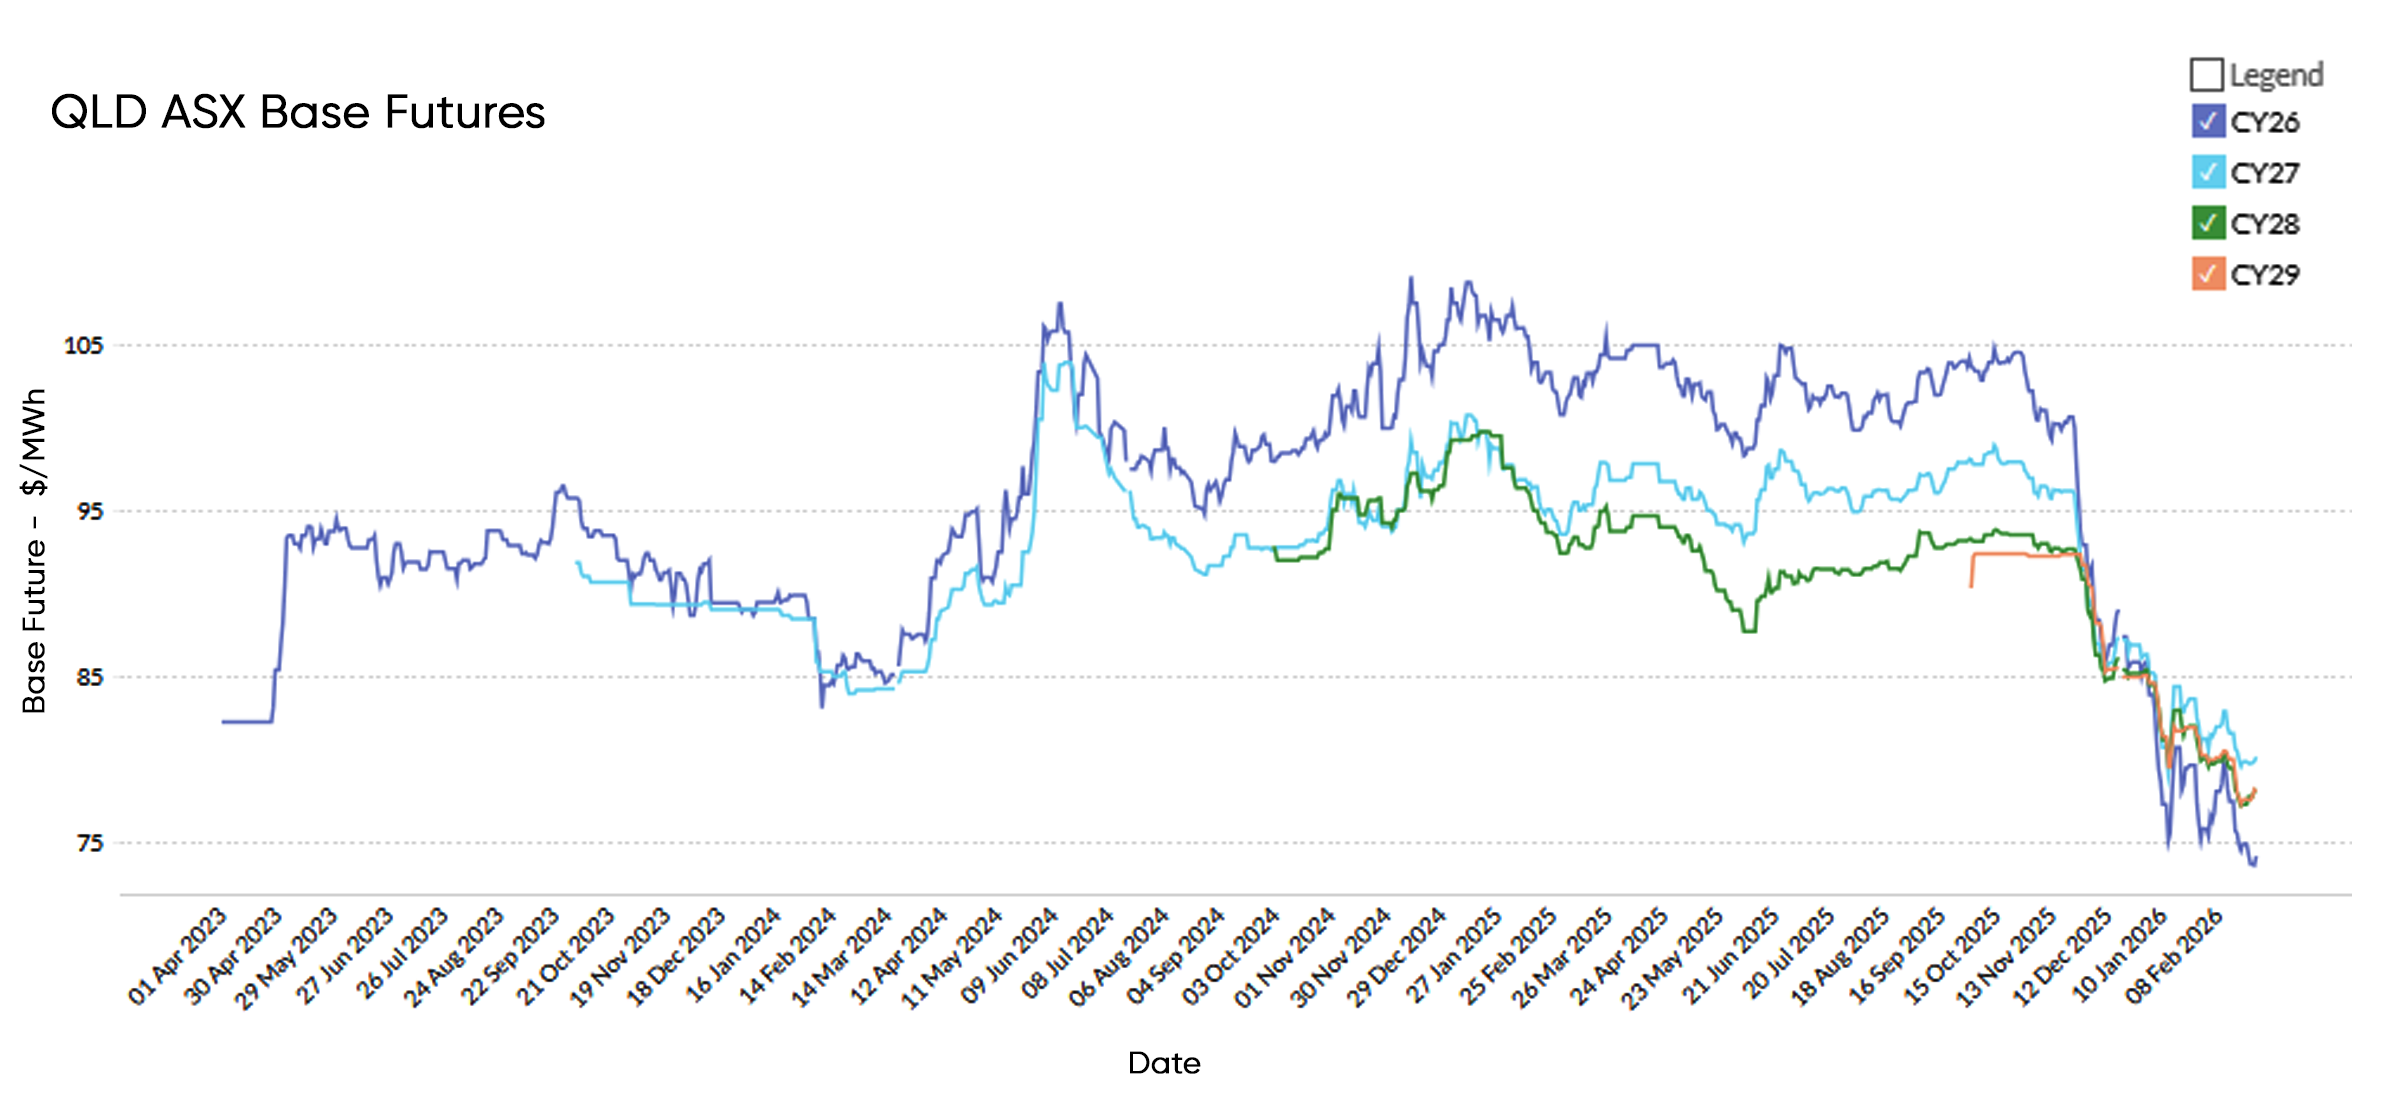
Futures
| Contract | Month Open | Month Close | % Change |
|---|---|---|---|
| CY26 | 75.84 | 74.19 | -2.2% |
| CY27 | 81.26 | 80.16 | -1.4% |
| CY28 | 80.06 | 78.14 | -2.4% |
| CY29 | 80.28 | 78.06 | -2.8% |
Generation Mix
| Metric | Feb-25 | Feb-26 | Change |
|---|---|---|---|
| Total generation (GWh) | 5,323 | 5,404 | +1.5% |
| Renewable share (%) | 31.7% | 38.0% | +6.3% |
| Coal share (%) | 63.9% | 57.8% | -6.1% |
| Gas share (%) | 6.7% | 4.6% | -2.1% |
| Battery discharge (GWh) | 16.8 | 87 | +418% |
| Renewable curtailment (GWh) | 69 | 35 | -49% |
| Emissions intensity (kgCO₂e/MWh) | 596 | 540 | -9.4% |
Victoria
Spot
Victorian spot prices declined sharply in February, averaging $45.06/MWh compared with $68.55/MWh in February 2025 (-34.3%).
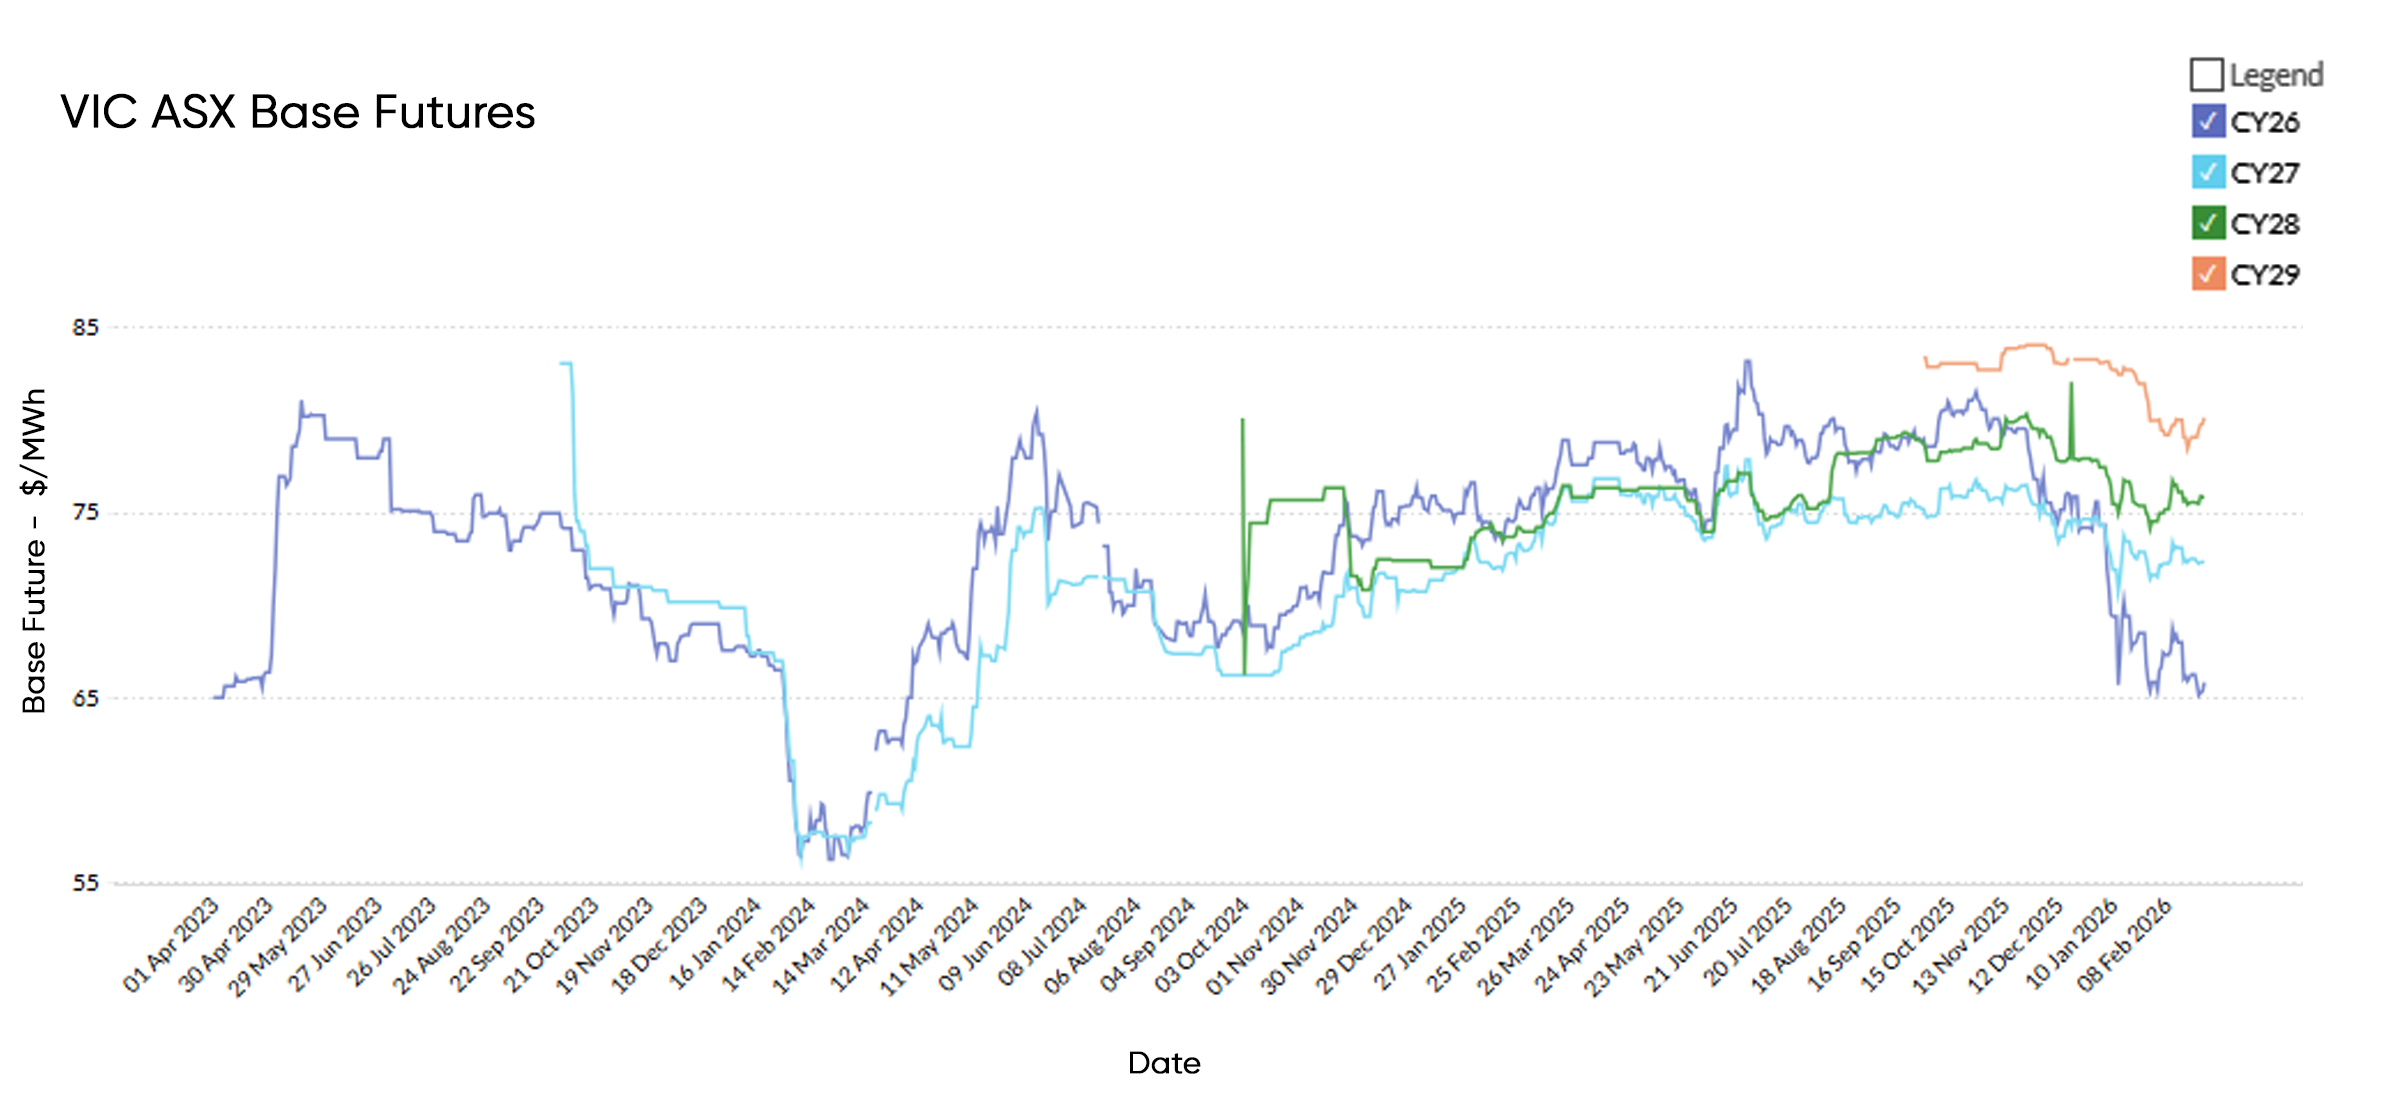
Futures
| Contract | Month Open | Month Close | % Change |
|---|---|---|---|
| CY26 | 65.85 | 65.83 | 0.0% |
| CY27 | 71.64 | 72.38 | +1.0% |
| CY28 | 74.56 | 75.85 | +1.7% |
| CY29 | 80.00 | 80.17 | +0.2% |
Generation Mix
| Metric | Feb-25 | Feb-26 | Change |
|---|---|---|---|
| Total generation (GWh) | 4,014 | 3,945 | -1.7% |
| Renewable share (%) | 52.3% | 51.2% | -1.1% |
| Coal share (%) | 55.2% | 56.6% | +1.4% |
| Gas share (%) | 1.9% | 0.7% | -1.2% |
| Battery discharge (GWh) | 22.5 | 64 | +184% |
| Renewable curtailment (GWh) | 127 | 183 | +44% |
| Emissions intensity (kgCO₂e/MWh) | 588 | 599 | +1.9% |
South Australia
Spot
South Australian spot prices fell significantly year-on-year, declining from $91.34/MWh to $56.00/MWh (-38.7%) as strong wind and solar output suppressed wholesale pricing.
Futures
| Contract | Month Open | Month Close | % Change |
|---|---|---|---|
| CY26 | 87.31 | 87.00 | -0.4% |
| CY27 | 84.59 | 84.33 | -0.3% |
| CY28 | 89.50 | 88.75 | -0.8% |
| CY29 | 93.53 | 92.50 | -1.1% |
Generation Mix
| Metric | Feb-25 | Feb-26 | Change |
|---|---|---|---|
| Total generation (GWh) | 1,289 | 1,262 | -2.1% |
| Renewable share (%) | 71.5% | 75.0% | +3.5% |
| Coal share (%) | 0.0% | 0.0% | 0.0% |
| Gas share (%) | 15.8% | 10.9% | -4.9% |
| Battery discharge (GWh) | 17.2 | 34 | +98% |
| Renewable curtailment (GWh) | 183 | 118 | -15% |
| Emissions intensity (kgCO₂e/MWh) | 183 | 172 | -6.0% |
Closing Commentary
February reinforced the broader transition underway across the National Electricity Market, with renewable generation continuing to expand and battery storage playing an increasingly important role in supporting system flexibility. These dynamics contributed to softer spot price outcomes across much of the NEM and reduced reliance on higher-cost gas generation during peak demand periods.
However, the market environment remains sensitive to global energy developments. The recent escalation of geopolitical tensions in the Middle East and the resulting movements in oil and LNG markets highlight how quickly external factors can influence Australian electricity pricing, particularly through forward contract markets.
As the year progresses, electricity prices will continue to be shaped by renewable availability, fuel cost movements, and broader global energy market conditions. Leading Edge Energy continues to monitor these developments closely to support clients with informed procurement decisions and proactive energy risk management.
Explainer: Why we focus on Wholesale Futures Prices
Wholesale Futures Price: This reflects what the market expects wholesale electricity spot rates to be in future periods. The offers that commercial and industrial (C&I) customers receive via Leading Edge Energy are closely correlated to wholesale prices on the ASX Energy futures market; this is why we focus on these prices in our commentary.
Spot Price: This represents how much the spot market is charging for electricity currently based on demand and supply. Spot prices go up when demand is high and supply is tight. You can view live Spot Prices here.
You can learn more about the difference between wholesale electricity futures and spot prices in our blog section.
Disclaimer: The information in this communication is for general information purposes only. It is not intended as financial or investment advice and should not be interpreted or relied upon as such.
We source, analyse, compare and rank commercial, industrial and multi-site energy quotes. Obligation Free.
Chat with one of our experienced consultants today and get the insights your business needs to help manage the risks associated with volatile electricity and natural gas markets. Our energy procurement service is obligation-free and provides a time-saving way of securing lower energy rates from our panel of energy retailers.
Get advice from our Energy Management Consultants

Ewen Beard
Sales Manager
Get in Touch
Feel free to call or e-mail us. Or just fill in the form below and we’ll contact you for an obligation-free discussion.
Are you ready to save on business energy costs?
Get StartedLeading Edge Energy is proud to be a signatory of the National Customer Code for Energy Brokers, Consultants and Retailers.