What do solar energy and a duck have in common: Curves. And no, that’s not a joke, it’s the correlation between excess solar supply during the day against peak demand in the early evening.
This is creating a situation where spot prices during the day are low, yet they skyrocket as soon as the sun sets at 5 till 9 pm as the grid tries to cope with the massive spike in demand for electricity.
The introduction of solar energy (especially on roof-tops) – which peaks during the day – has led to a reduction in demand for grid-sourced electricity generation.
Electricity users consume power in a very typical manner. Demand begins to pick up in the morning and traditionally, this remains constant during the day before hitting its peak at sundown and tapering off during the night.
With the widespread uptake of rooftop solar, many households and businesses have become self-sufficient during the day, meaning that they do not need to draw power from the grid. This creates the Duck Curve. Check out this video by Vox for a visual explanation.
The Duck curve was discovered by researchers at California Independent System Operator who modelled what large scale solar generation would look like back in 2010.
Fast forward nine years and their projections have become reality – The Duck Curve is the biggest challenge that renewable energy is facing.
Electricity is very difficult to store so grid managers use demand curves to anticipate the electricity needs of energy users.
As the video states, if they do that job well, we should not even notice. But the growth of solar energy is making that job much more difficult.
Grid operators regard solar power as being unconventional in supply.
They can’t control or “dispatch” it on their own schedule because it is dependent on the sun’s cycle.
As a result, they must accommodate it.
So from that point of view, more solar (or wind) power looks like a reduction in demand for dispatchable power.
The economic problem
Solar has reduced the demand for baseload power during sunlight hours. Most traditional fossil fuel-fired power plants take time to peak (fire up) meaning that they are not responsive to big demand fluctuations. In addition, for them to run profitably, they need to be running 24-hours a day and seven days a week.
Rooftop solar eats into demand for traditional grid-sourced electricity and large scale solar energy peaks during the middle of the day. But if power stations were to be switched off during the day, this would completely mess up their economics.
Therefore, they are kept rolling, creating a sort of artificial floor, as illustrated in the video.
If too much solar power enters the grid and there is no one there to consume it, it leads to overgeneration and grid managers simply need to curtail output by potentially turning large scale commercial solar panels off.
If they didn’t the grid would become overloaded and could even be damaged extensively.
The reduction in demand for baseload power is causing thermal generators to make less money when they sell to the spot market.
This is making them less viable, meaning that it is not worth spending money on maintenance to keep them running.
A perfect example was when the Hazelwood coal plant in Victoria shut in 2017 without warning.
Thermal power plants have traditionally been relied upon to cover the “super peak” periods (6-9 pm each day), but as they close, the grid is relying more on expensive peak load generators like gas, which is costly.
For a better visual of how the duck curve works, Leading Edge Energy has created charts that demonstrate the average demand for electricity at any given time of day for the last decade. It is clearly seen that in the latest years the curve has become steeper; reducing demand during day time and increasing demand during peak hours. Navigate through the tool below to understand the impact of solar energy on demand.
This is what is pushing the duck’s head up as can be seen in the chart above.
It’s the duck’s head going higher and higher which is causing the problem.
Check out Leading Edge Energy’s energy analysis charts and tools here.
The duck curve storage and conversion challenge
The biggest challenge with moving to a 100 percent renewable energy powered grid is storing it, so businesses can then utilise it at night.
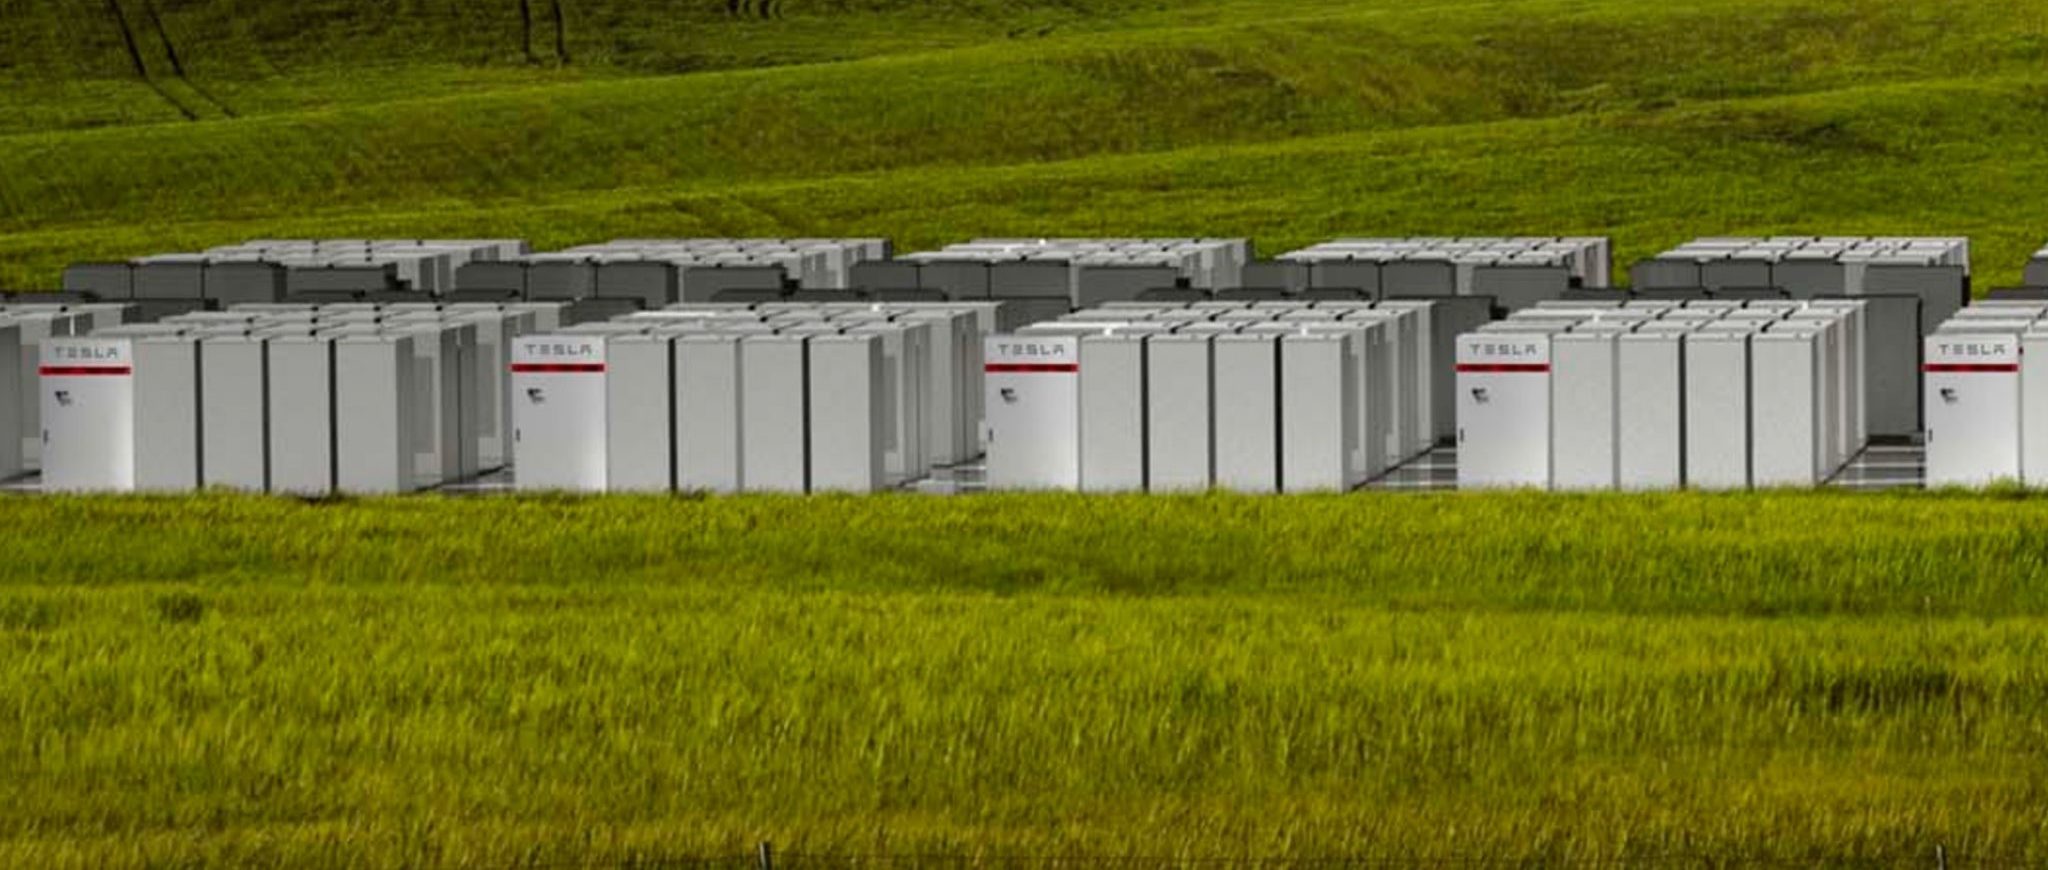
Australia experienced its first taste of what a mass battery storage project can do when South Australia’s Tesla Battery kicked into action to avert a blackout in Victoria in 2018.
A number of other batteries are being built in Victoria. A whole night’s worth of demand for energy cannot be supplied by batteries but they can be used in an emergency to dispatch power to the grid.
Google is also experimenting with a combination of molten salt and antifreeze fluid to create a new-age battery in a project called ‘Malta’.
Australia’s Energy network is already looking at using batteries and pumped hydro as a way to firm up capacity against renewable energy depletion.
Want to learn more about rooftop solar?
Do you want to become part of the solar revolution? Our Energy Management Consultants will advise you about the optimal system which could help save thousands.
Learn more about our energy management process in our services page, or visit our blog to read updates on the latest in energy generation technology, happenings in the energy industry, as well as find tips for maximising your site’s lighting efficiency, among others.
Call us on tel: 1300 852 770 or send us an email at hello@leadingedgeenergy.com.au for a free consultation.


