
As spring gave way to early summer, the National Electricity Market (NEM) remained stable on the surface — but October revealed the fragility beneath.
Average spot prices across the NEM eased to $51/MWh, down 4.5% from September and broadly flat year-on-year, as mild weather, strong renewable output, and low daytime demand kept volatility contained.
State results diverged. New South Wales rose to $77/MWh amid multiple AEMO system strength directions and intermittent coal outages.
Queensland edged up to $56/MWh as Callide’s continued reliability issues cast a shadow over supply.
Victoria ($51/MWh) and South Australia ($50/MWh) both softened, supported by high renewable output and strong interconnector flows, while Tasmania ($25/MWh) recorded the lowest prices nationally.
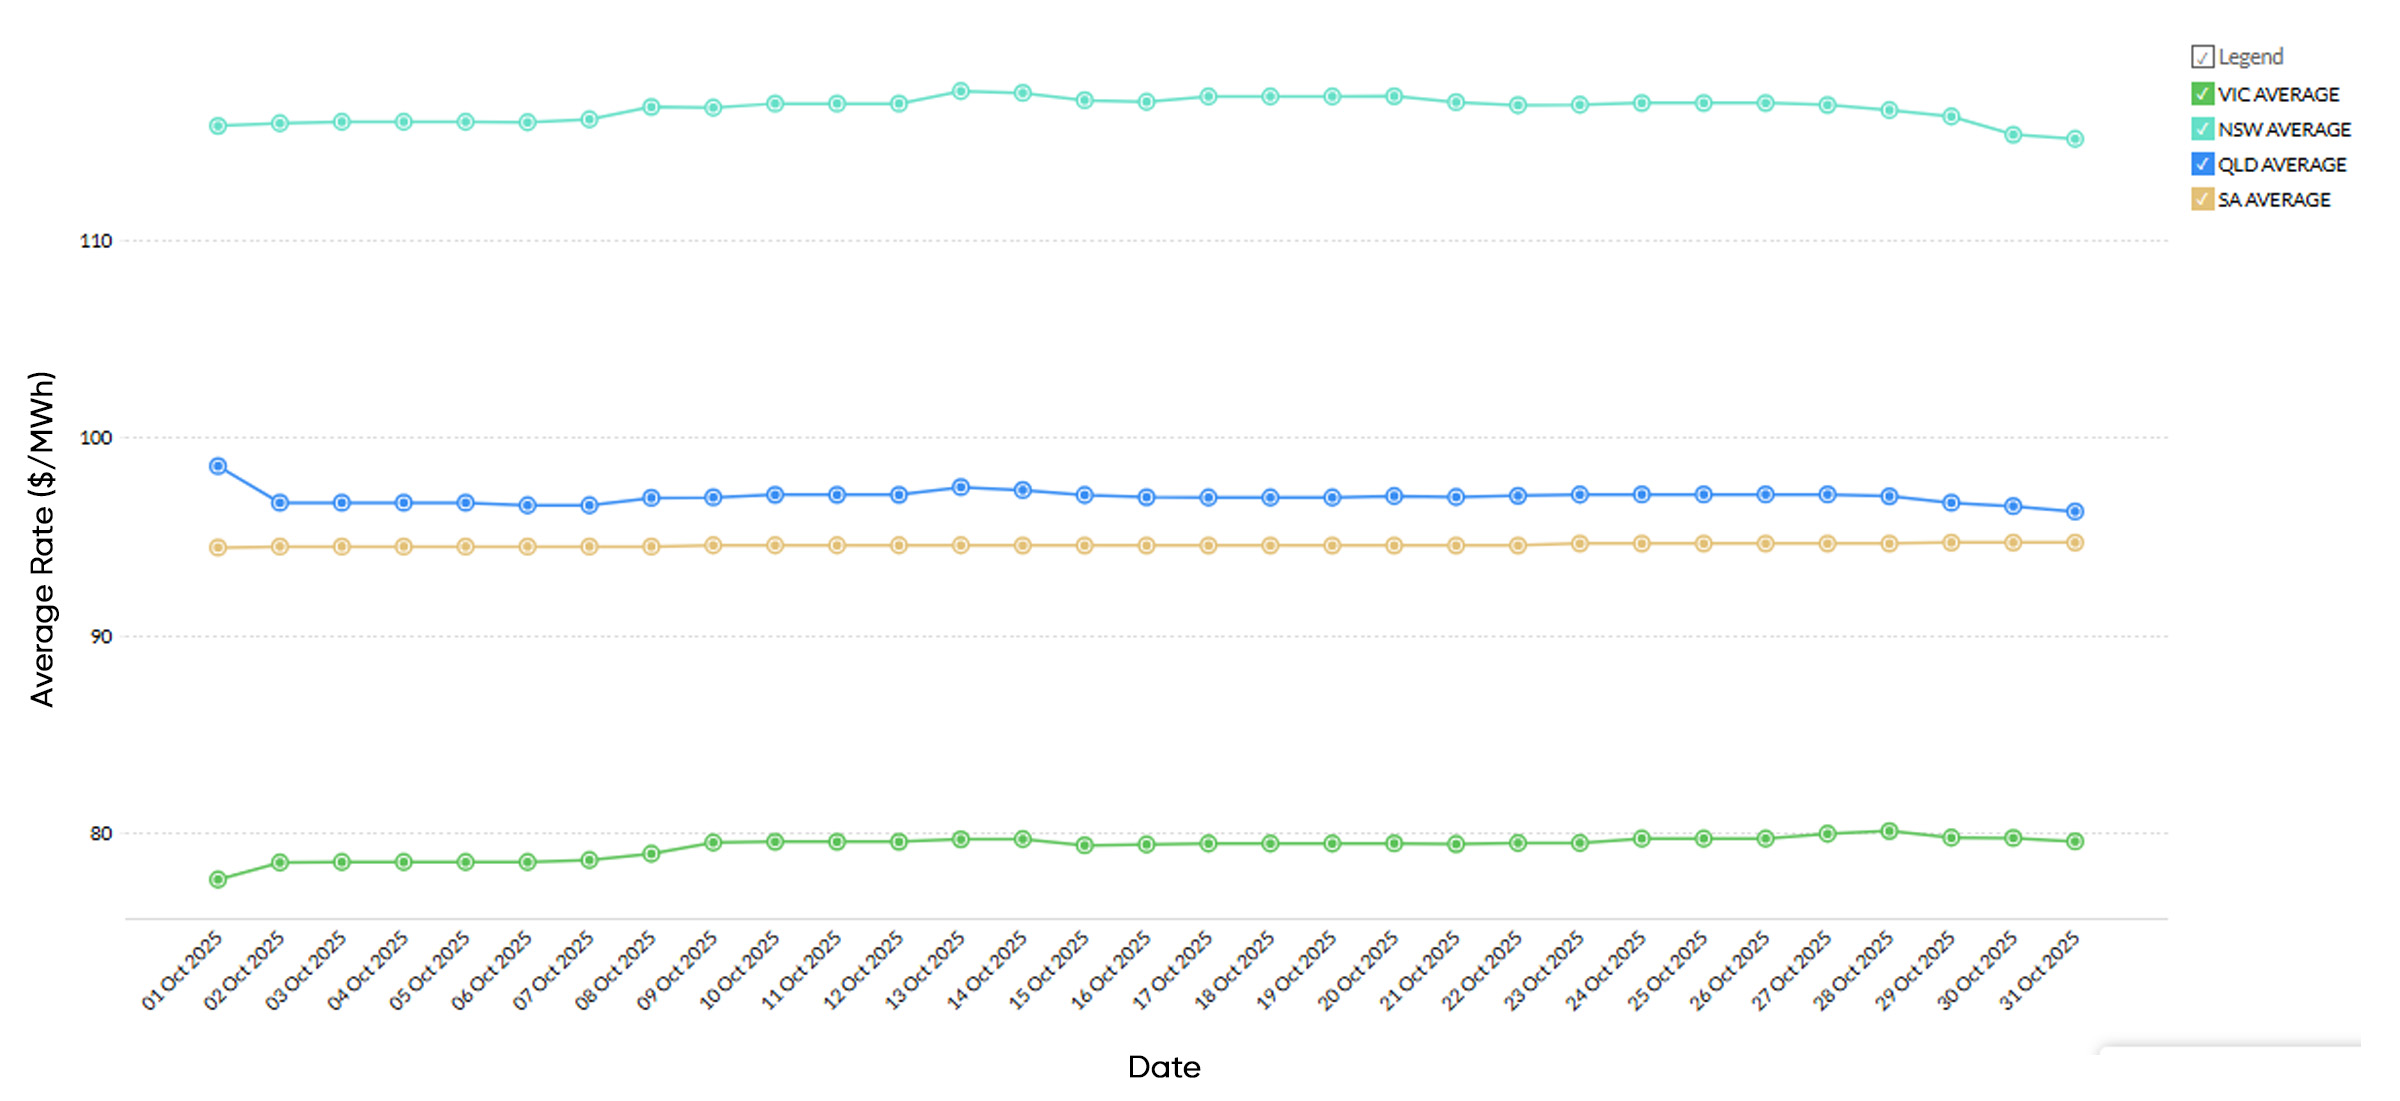
Futures activity was mixed. NSW 2026 closed at $117/MWh (steady month-on-month), Queensland softened to $103/MWh, Victoria firmed to $81/MWh, and South Australia inched higher to $96/MWh.
The national average 2026 contract settled at $96.9/MWh, reflecting two months of calm following winter’s volatility.
But behind the stability, operational strain deepened — with increased AEMO interventions, multiple coal outages, and record solar curtailment exposing systemic vulnerabilities.
Futures Flat, Mixed Spot — System Strain Rising
October’s spot calm concealed a month of high operational activity.
NSW was directed for system strength on 5th, 29th, and 30th October, underscoring tight synchronous generation margins.
Victoria experienced concurrent stress events, with Yallourn Units 3 and 4 tripping on 16th October, temporarily removing 600 MW, and a short-notice Loy Yang A4 outage on 15th October prompting further system strength directions.
Queensland faced two frequency events after Callide C4 (26th) and B2 (28th) tripped, briefly disrupting supply and reinforcing lingering reliability concerns at the site.
Despite these issues, sharp price spikes were contained, with AEMO interventions and battery dispatch helping maintain frequency and stability.
Structural Risks Persist Across the Curve
While prices remain subdued, the month highlighted that stability is increasingly dependent on intervention. The pattern of system strength directions and synchronous support across NSW and Victoria shows that renewable growth is outpacing grid adaptation.
Coal reliability remains the core risk. Eraring’s continued cycling for short-notice maintenance, coupled with Yallourn and Callide trips, illustrates the thin margin of firm capacity underpinning the market. With Eraring’s closure still under review and Vales Point’s future uncertain, traders are maintaining risk premiums in NSW and QLD futures despite calm spot conditions.
Transmission delays continue to weigh on long-term confidence. Progress on VNI West, Marinus Link, and EnergyConnect remains slow, and cost blowouts are eroding investor trust that new renewable zones will connect before major coal exits.
Curtailment and flexibility remain front of mind. Early October saw record low NEM demand (9,393 MW) and large-scale solar curtailment exceeding 70%, highlighting limited midday flexibility despite rising battery participation. The situation underscores AEMO’s recent launch of transitional system security services (24 October), designed to manage inertia and stability shortfalls as synchronous generation declines.
Gas exposure continues to shape risk in Victoria and South Australia, where domestic contracts remain partially linked to LNG-indexed pricing. Policy developments such as the Queensland Energy Roadmap 2025 add further uncertainty around the pace of the coal-to-renewables transition and the role of gas in firming.
What This Means for Energy Buyers
Short-term stability offers opportunity, but not certainty. Prices are subdued, yet futures curves already reflect the risks of summer demand, coal retirements, and system strength interventions.
With ageing assets under strain and grid stability increasingly managed through directions rather than design, the window to secure value remains open — but narrowing.
If your electricity contract expires in the next 6–12 months, now is the time to review, negotiate, and lock in competitive pricing before summer volatility and structural pressures return.
Leading Edge Energy helps you navigate these shifts — combining futures data, spot insights, and policy intelligence to give you a clear path forward in a changing energy landscape.
National Energy Market
Futures – Average of Terms
National Electricity Futures
The average electricity futures price for 2026 across New South Wales, Victoria, Queensland, and South Australia closed October at $96.91/MWh, down slightly from September’s $98.79/MWh. This 1.9% month-on-month easing reflects a market that has largely stabilised into late spring following the sharp winter correction.
- NSW traded between $115.73 and $115.07/MWh, holding near recent highs amid ongoing concern over coal-unit reliability ahead of summer.
- Victoria rose from $77.67 to $79.60/MWh, extending modest gains as local contracts firmed on stronger demand expectations.
- Queensland eased from $98.55 to $96.26/MWh, reflecting confidence in generation availability and improving solar penetration.
- South Australia was steady, edging from $94.44 to $94.69/MWh, consistent with subdued volatility in the state’s highly renewable mix.
Overall, futures softened marginally but remain elevated relative to long-term averages, with traders balancing near-term stability against persistent structural risks. Key drivers remain unchanged:
- Transmission delays: Ongoing cost and schedule blowouts across VNI West, Marinus Link, and Snowy 2.0 are constraining confidence in timely renewable integration.
- Firming capacity: Despite an expanding battery pipeline, long-duration storage and gas firming projects are progressing slowly, raising concerns about a mid-decade “firming gap.”
- Gas exposure: Victoria and South Australia remain partially tied to LNG-indexed gas pricing, leaving them vulnerable to global supply shocks.
- Policy uncertainty: The rollout of the Capacity Investment Scheme and overlapping state initiatives remain under scrutiny, with investors seeking clearer long-term signals.
At these levels, 2026 futures remain broadly aligned with late-2024 averages, suggesting a market that is calm in the short term but still hedging against structural tightness and policy-driven volatility in the latter half of the decade.
Spot Market Price Changes
| Period | FY 2025 | FY 2026 | Movement |
| FY Price | $80/MWh | $$75.86/MWh | ↓ 5.2% YoY |
| June | $159/MWh | $232/MWh | ↑ 46% YoY |
| July | $163/MWh | $109/MWh | ↓33% YoY |
| August | $149/MWh | $90/MWh | ↓ 39.6% YoY |
| September | $45.57/MWh | $53.42/MWh | ↑ 17.2% YoY |
| October | $50.73/MWh | $51/MWh | ↑ 0.5% YoY |
In October 2025, the National Electricity Market (NEM) recorded an average spot price of $51.00/MWh, down 4.5% from September’s $53.42/MWh and broadly in line with October 2024 ($50.73/MWh). The result marks a continuation of the post-winter correction and reinforces the system’s return to stability after mid-year volatility.
At the state level, prices diverged modestly.
- New South Wales rose 8.1% to $77.02/MWh, reflecting firmer evening demand and lower wind conditions.
- Queensland edged 2.4% higher to $55.66/MWh, supported by steady solar output and reliable coal performance.
- Victoria eased 7.1% to $51.37/MWh, cushioned by strong daytime renewables and mild spring weather.
- South Australia fell 12.9% to $50.17/MWh as wind generation strengthened and volatility subsided.
On a year-to-date basis, NEM spot prices now average around $75.86/MWh, a sharp decline from FY24’s $80/MWh, signalling a more balanced market shaped by renewable growth, improved coal availability, and muted demand. The October outcome suggests a stable trading band near $50–55/MWh, though summer conditions and potential coal or gas disruptions remain key watchpoints heading into 2026.
New South Wales Energy Market
Electricity Futures Prices
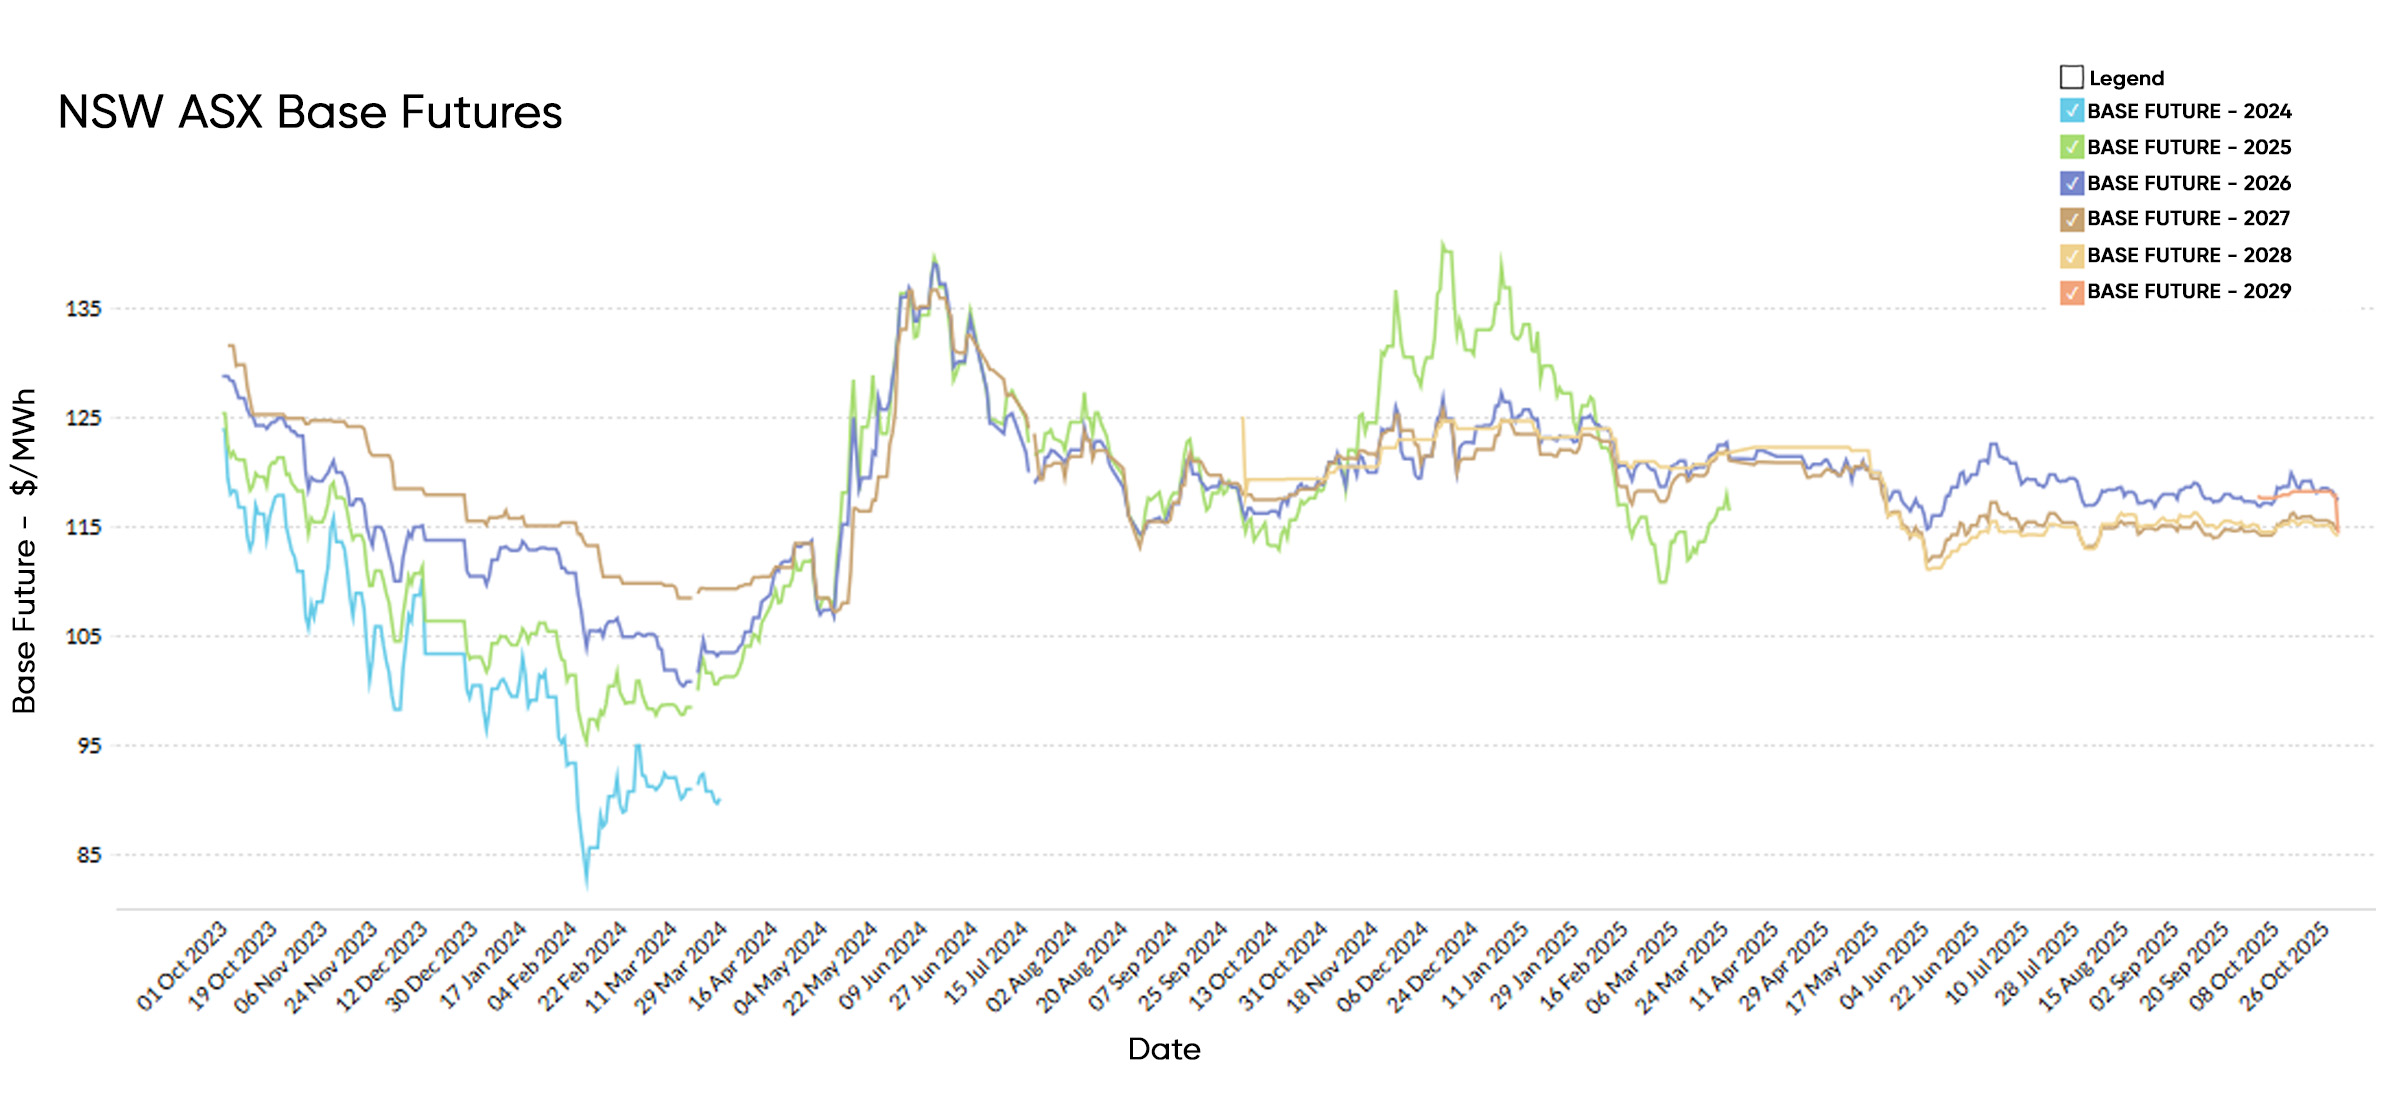
New South Wales electricity futures for 2026 opened October at $117.32/MWh and closed slightly lower at $117.21/MWh, a marginal $0.11 decline that underscores a steady market heading into summer.
The minimal movement follows two months of relative calm after the volatility seen mid-year, reflecting balanced trading conditions and confidence in short-term supply.
Longer-dated contracts were similarly stable:
• 2027 futures closed at $114.20/MWh (down from $114.44 in September)
• 2028 futures ended at $114.25/MWh, almost unchanged month-on-month.
The flat curve indicates traders are maintaining moderate risk premiums without significant new buying or selling pressure.
Stability in coal availability, firm renewables performance, and subdued demand have tempered volatility, even as concerns linger around the scheduled Eraring closure in 2025 and transmission project delays.
At $117.21/MWh, 2026 futures sit 1.4% below October 2024’s $118.90/MWh, signalling a slightly softer medium-term outlook while maintaining a cautious hedge against potential supply shocks and summer reliability risks.
New South Wales – Spot Market
Average electricity spot prices in New South Wales increased from $71.24/MWh in September to $77.02/MWh in October, a 8.1% month-on-month rise.
Prices were broadly in line with October 2024 ($77.41/MWh).
The modest lift was driven by firmer evening demand, mild heat across early spring, and several low-wind intervals that reduced renewable output.
Negative pricing continued during daylight hours as solar generation peaked, highlighting the deepening influence of weather and rooftop PV on daytime price formation.
Overall, NSW prices remained well below mid-year levels, reflecting improved coal unit reliability and steady interconnector flows from Queensland and Victoria.
Energy Generation Mix
Coal remained the dominant source of electricity in New South Wales, generating 59.3% (43,736 GWh) of total output at an average price of $139.00/MWh. While still the backbone of supply, ongoing unit cycling and short-notice maintenance at Eraring highlighted the ageing fleet’s fragility.
Renewables contributed 38.0% (28,078 GWh), reflecting strong springtime solar and wind conditions across the state.
- Rooftop Solar supplied 12.9% (9,489 GWh) at an average of $55.71/MWh, boosted by mild weather and expanding residential capacity.
- Utility-Scale Solar delivered 11.1% (8,192 GWh) at $57.40/MWh, supported by consistent grid-connected output.
- Wind provided 10.4% (7,690 GWh) at $99.81/MWh, stable through the month despite occasional low-wind intervals.
- Hydro generation accounted for 3.5% (2,592 GWh) at $313.05/MWh, dispatched primarily during peak demand periods and system strength directions.
Gas-fired generation made up 2.4% (1,739 GWh) at an average price of $333.42/MWh, typically covering evening peaks and low-renewable windows.
Distillate contributed just 0.007% (5 GWh) but at an extreme $858.75/MWh, reflecting rare emergency use during reliability events.
Battery discharge remained modest at 0.3% (242 GWh) but highly valuable at $290.96/MWh, highlighting storage’s expanding role in capturing peak margins and providing frequency control services.
Weighted average prices by generation type – NSW (October 2025):
- Renewables (Wind, Solar, Hydro): $92.59/MWh
- Coal: $139.00/MWh
- Gas (including Distillate): $333.42/MWh
- Battery (Discharging): $290.96/MWh
Victoria Energy Market
Electricity Futures Prices
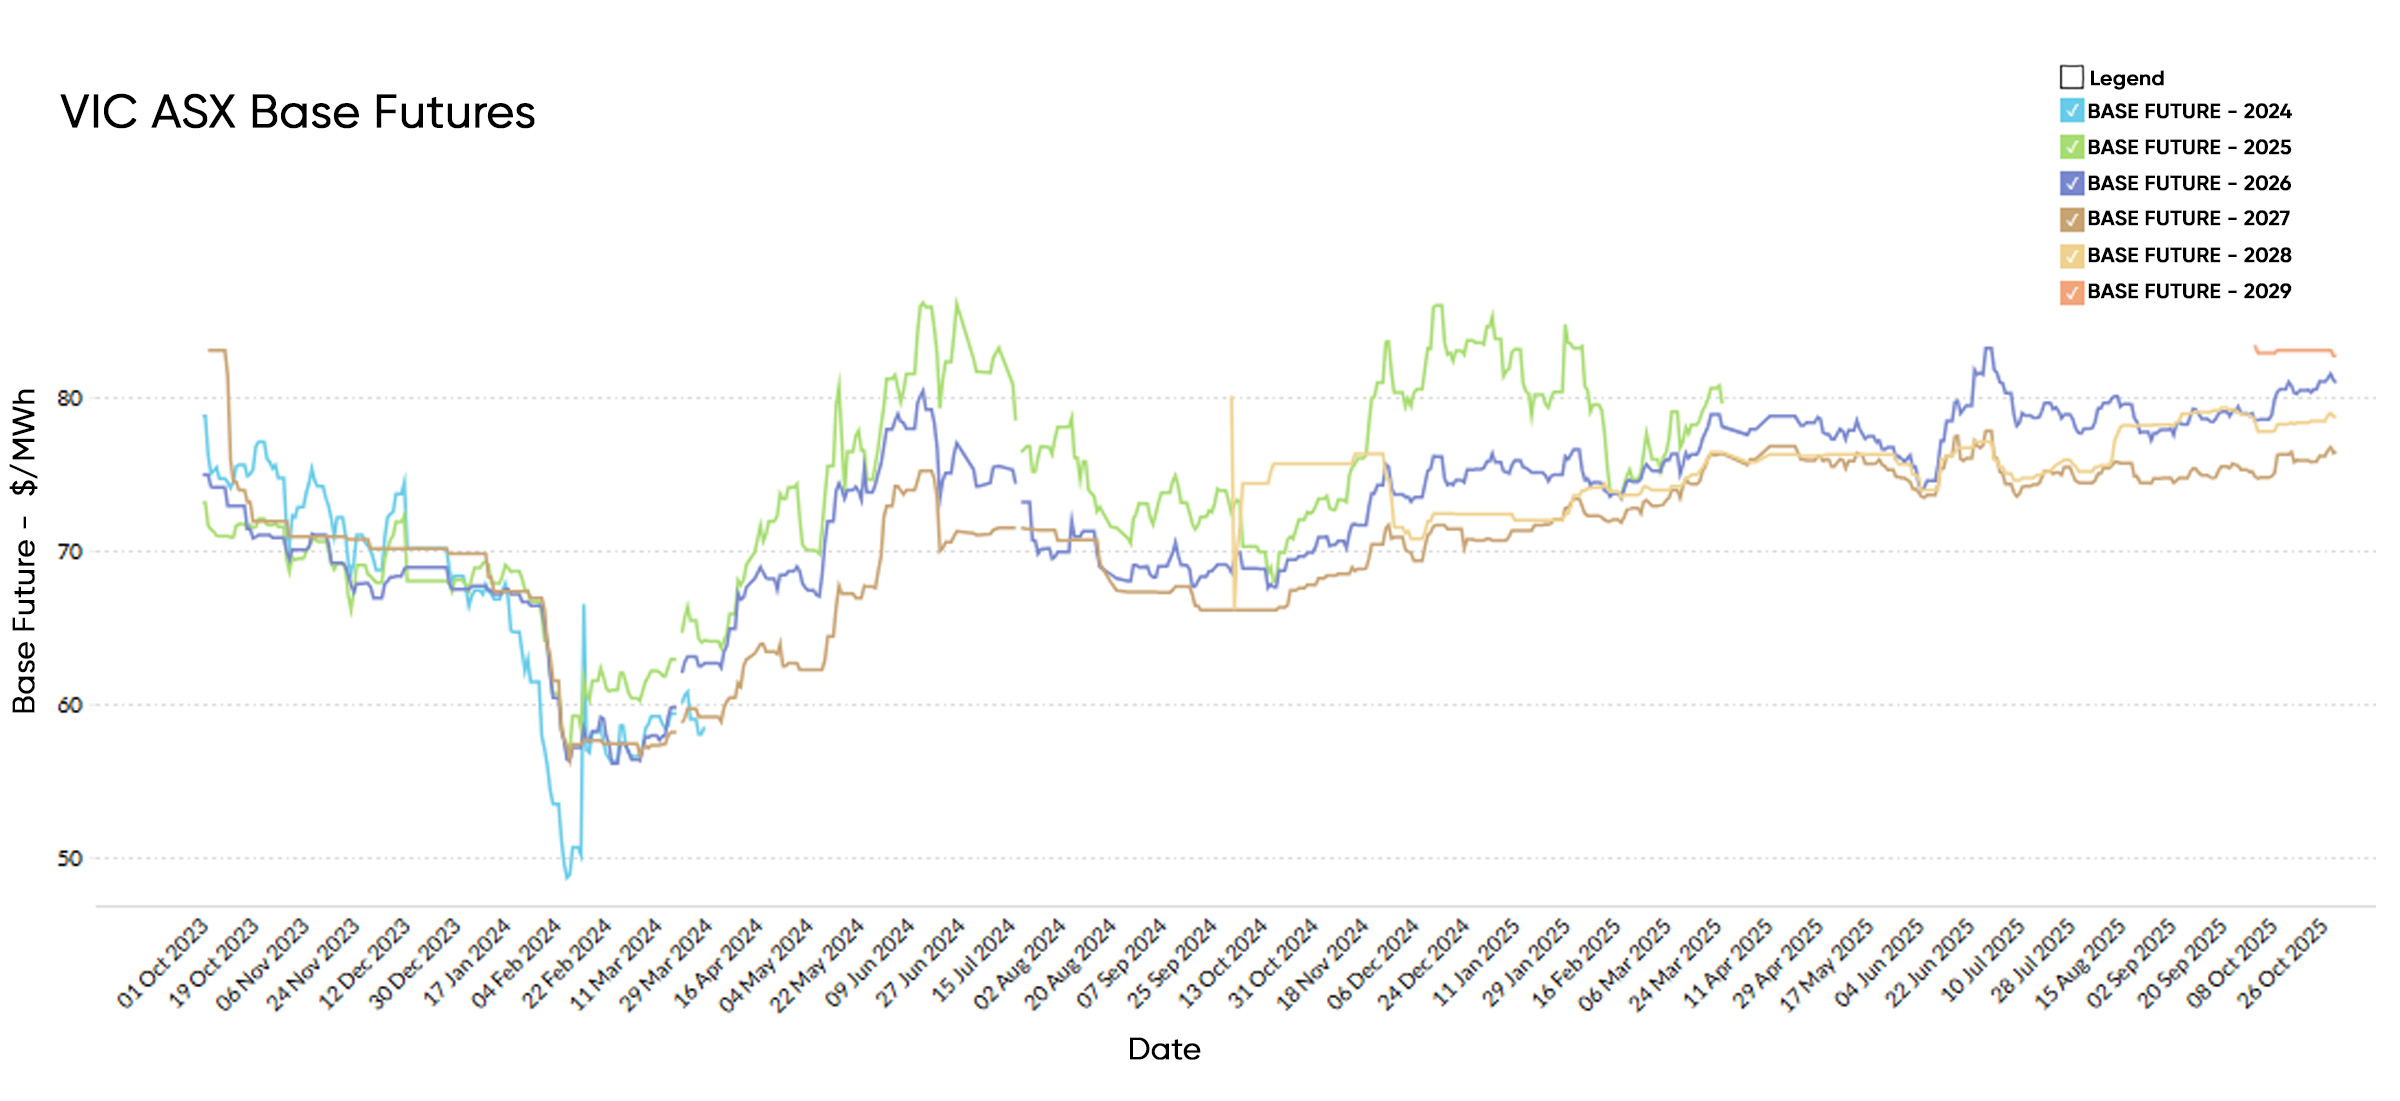
Victoria electricity futures for 2026 opened October at $79.00/MWh and closed higher at $80.62/MWh, a $1.62 increase that extends the mild firming trend seen through spring. The uplift reflects stronger forward hedging as market participants prepare for summer demand and factor in lower hydro inflows and variable wind output.
Longer-dated contracts were largely unchanged:
• 2027 futures edged down to $78.78/MWh (from $78.85/MWh)
• 2028 futures remained steady around $78.70/MWh.
The slight rise in the 2026 contract suggests growing caution around short-term supply tightness rather than a structural shift in sentiment. With transmission upgrades still delayed and renewables occasionally curbed by network constraints, traders are pricing a modest premium into near-term delivery periods.
At $80.62/MWh, Victoria’s 2026 futures are 15.2% higher than October 2024’s $69.97/MWh, reflecting both improved contract liquidity and a recognition that while volatility has eased, underlying risks around firming capacity and summer reliability persist.
Victoria – Spot Market
Average electricity spot prices in Victoria eased from $55.27/MWh in September to $51.37/MWh in October, a 7.1% month-on-month decline.
Prices, however, were still 152% higher than in October 2024 ($20.36/MWh), when record renewable output and mild demand sent prices to historic lows.
The softening through October reflected abundant daytime solar generation and improved wind conditions, which regularly pushed prices into negative territory during midday hours.
Evening peaks were relatively contained thanks to strong interconnector support and mild temperatures. Despite the year-on-year increase, volatility remained moderate and average prices continued to track well below winter’s elevated levels.
Energy Generation Mix
Coal remained the dominant source in Victoria, generating 54.0% of electricity (29,965 GWh), consistent with recent months and supported by improved availability across the Latrobe Valley fleet.
Renewables contributed a strong 43.0% (23,877 GWh), maintaining Victoria’s position as one of the National Electricity Market’s cleanest regions.
- Wind remained the largest renewable source, supplying 23.1% (12,844 GWh) at an average price of $50.97/MWh, reflecting steady output across coastal and western wind farms.
- Rooftop Solar delivered 11.3% (6,297 GWh) at a very low $15.86/MWh, benefiting from mild spring weather and longer daylight hours.
- Utility-Scale Solar accounted for 4.0% (2,223 GWh) at $29.23/MWh, consistent with improving grid-connected solar performance.
- Hydro contributed 4.5% (2,514 GWh) at $187.61/MWh, dispatching mainly during peak-demand periods.
Gas supplied 2.3% (1,255 GWh) at an average price of $314.86/MWh, highlighting its limited but high-cost role in balancing the grid during low-renewable intervals.
Battery discharge increased to 0.8% (430 GWh) at $227.76/MWh, showing strong participation in evening peaks and frequency control services.
Weighted average prices by generation category in Victoria – October 2025:
- Renewables (Wind, Solar, Hydro): $54.07/MWh
- Coal: $139.00/MWh*
- Gas: $314.86/MWh
- Battery (Discharging): $227.76/MWh
Queensland Energy Market
Electricity Futures Prices
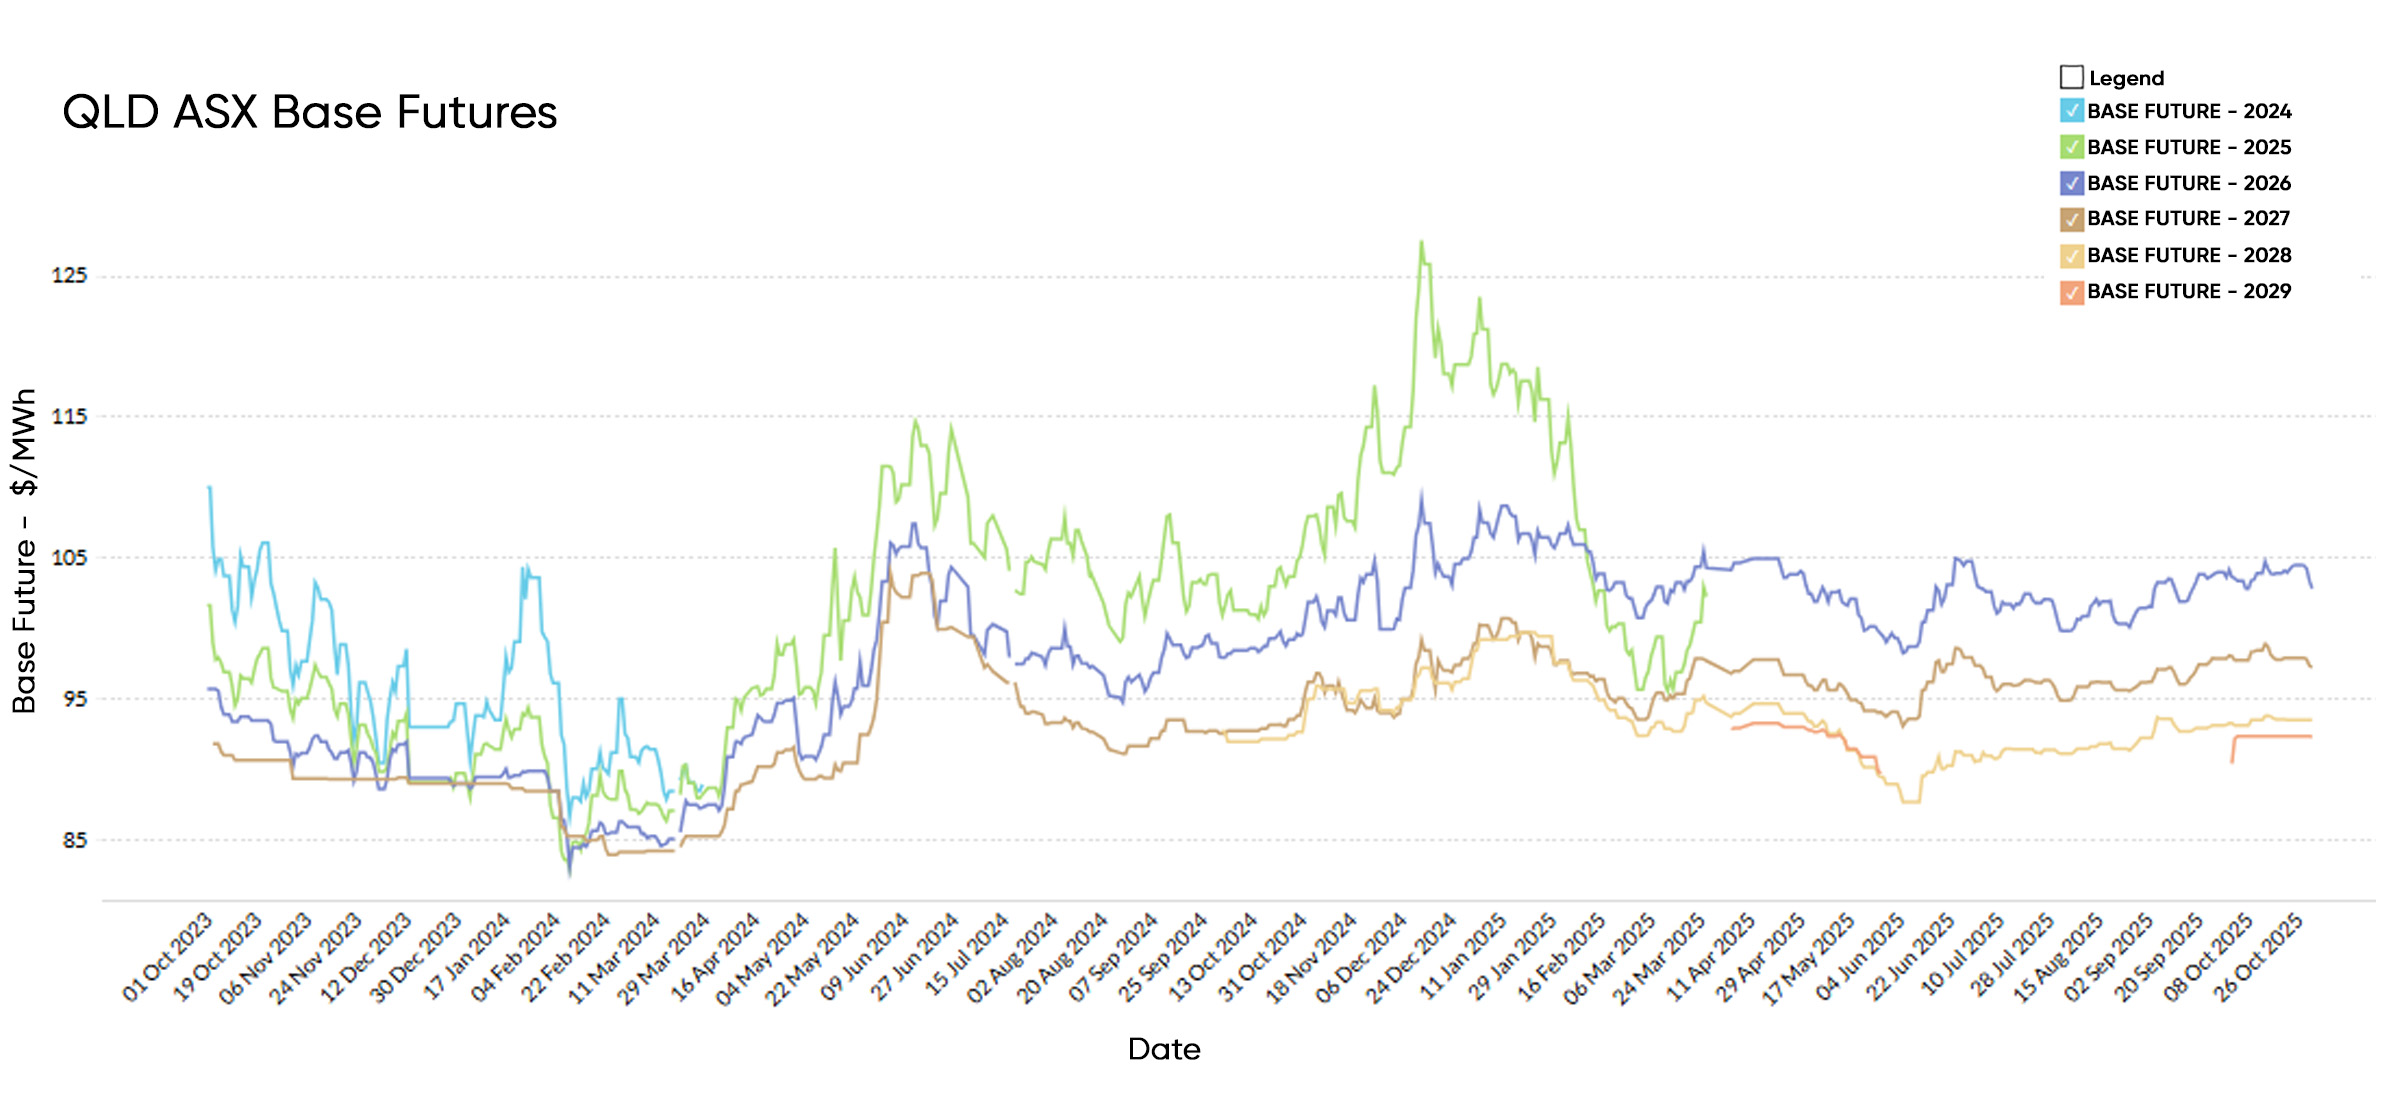
Queensland electricity futures for 2026 opened October at $104.20/MWh and closed at $102.89/MWh, a $1.31 decline that continues the gentle softening observed since late winter. The easing reflects steady generation availability, robust solar output, and lower gas price pressure — all contributing to subdued forward risk as summer approaches.
Longer-dated contracts also moved slightly lower:
• 2027 futures closed at $97.29/MWh
• 2028 futures at $93.56/MWh, maintaining a downward-sloping curve consistent with expectations of gradual renewables expansion and firming investment.
The modest retreat highlights improved supply confidence following a year of strong operational performance from both coal and gas units, alongside continued growth in rooftop and utility-scale solar. However, elevated daytime generation is still offset by tightening evening peaks, preserving a moderate risk premium.
At $102.89/MWh, Queensland’s 2026 futures remain 3.3% above October 2024’s $99.62/MWh, signalling that while volatility has eased, traders are still pricing a cautious buffer against heat-driven demand spikes and potential grid congestion over summer.
Electricity Spot Prices
Average electricity spot prices in Queensland edged up from $54.35/MWh in September to $55.66/MWh in October, a modest 2.4% month-on-month increase.
Prices were 21.5% lower than in October 2024 ($70.85/MWh), reflecting a significant easing in volatility compared with last year’s elevated conditions.
October’s stability was underpinned by strong solar generation and steady coal plant performance, which kept daytime prices subdued. Brief evening peaks occurred during lower renewable output and interconnector constraints, but overall price volatility remained contained.
Negative daytime pricing persisted on several mild, sunny days, highlighting Queensland’s growing exposure to rooftop solar generation and the midday supply surplus it creates.
Energy Generation Mix
Coal remained Queensland’s dominant energy source in October, generating 57.9% (3,421 GWh) of total electricity at an average price of $66.52/MWh. Unit availability improved through the month, though unplanned outages at Callide B2 and C4 again highlighted reliability risks within the state’s ageing baseload fleet.
Renewables contributed a solid 37.3% (2,203 GWh), driven by strong solar production and consistent wind and hydro support.
- Rooftop Solar provided 16.9% (1,000 GWh) at a very low $4.08/MWh, reflecting abundant sunshine and mild weather.
- Utility-Scale Solar added 10.0% (592 GWh) at $10.91/MWh, maintaining stable output across large regional arrays.
- Wind supplied 7.4% (440 GWh) at $71.40/MWh, with output varying through the month but adding valuable diversity to daytime generation.
- Hydro delivered 2.3% (134 GWh) at $96.28/MWh, used mainly for evening peak support.
Gas generation contributed 4.2% (246 GWh) at an average cost of $94.78/MWh, supporting reliability during low-renewable periods.
Distillate supplied just 0.02% (1.4 GWh) but at a high $183.88/MWh, reflecting use in contingency and reserve events.
Battery discharge reached 0.7% (42 GWh) at $110.14/MWh, capturing value during late-afternoon peaks and providing ancillary frequency services.
Weighted average prices by generation type – Queensland (October 2025):
- Renewables (Wind, Solar, Hydro): $25.91/MWh
- Coal: $66.52/MWh
- Gas (including Distillate): $94.78/MWh
- Battery (Discharging): $110.14/MWh
South Australia Energy Market
Electricity Futures Prices
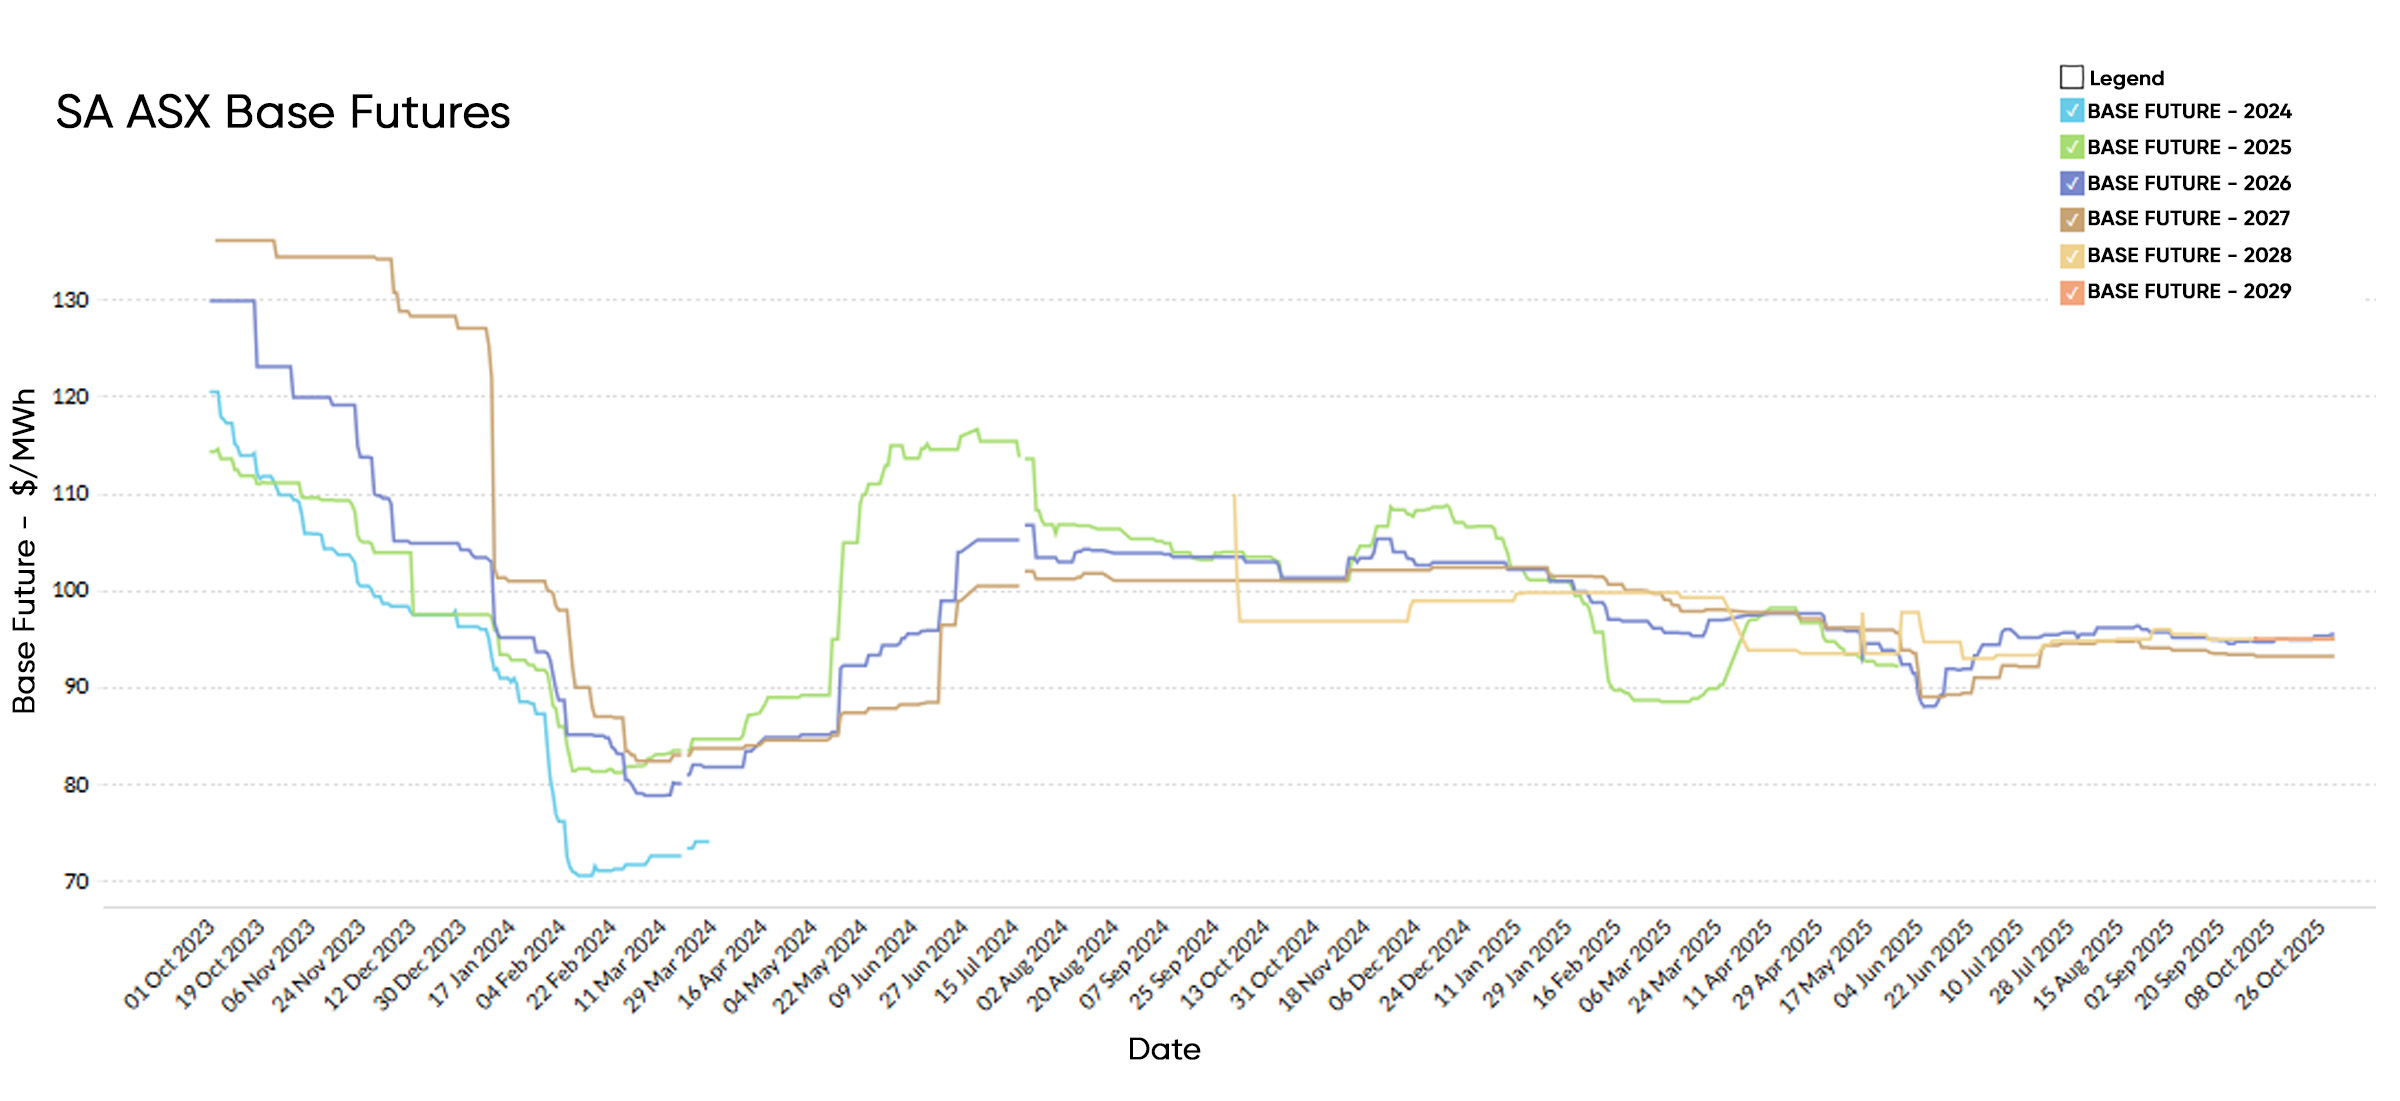
South Australian electricity futures for 2026 opened October at $94.91/MWh and closed slightly higher at $95.92/MWh, a $1.01 increase that extends the state’s stable trading pattern through spring. The marginal firming reflects moderate hedging activity ahead of summer, with participants balancing strong renewable performance against potential volatility from low-wind intervals.
Longer-dated contracts softened marginally:
• 2027 futures closed at $93.22/MWh
• 2028 futures at $95.00/MWh, maintaining a relatively flat forward curve that signals confidence in South Australia’s growing mix of wind, solar, and battery capacity.
The gentle uptick in near-term pricing suggests traders are building small premiums into summer quarters, acknowledging that even brief calm or cloudy periods can tighten supply in an otherwise renewable-heavy system.
At $95.92/MWh, 2026 futures sit 5.3% below October 2024’s $101.33/MWh, pointing to a calmer outlook year-on-year as battery participation deepens and interconnector support from Victoria continues to smooth short-term volatility.
South Australia – Spot Market
Average electricity spot prices in South Australia fell from $57.60/MWh in September to $50.17/MWh in October, a 12.9% month-on-month decrease.
Prices were 42.3% higher than in October 2024 ($35.24/MWh), when exceptionally strong wind and solar output drove record lows.
The October decline reflected abundant renewable generation—particularly from wind and rooftop solar—which regularly pushed prices into negative territory during daylight hours.
Gas units were dispatched mainly in the evenings and overnight, limiting sustained price spikes. Volatility eased markedly compared with September, underscoring the state’s increasing ability to self-balance through high renewable penetration and battery participation during peak periods.
Energy Generation Mix
Renewables continued to dominate South Australia’s generation profile, supplying an impressive 76.0% of electricity (11,235 GWh), among the highest renewable shares in the National Electricity Market.
Wind remained the backbone of the state’s generation mix, producing 46.6% (6,898 GWh) at an average of $62.94/MWh, with consistent output across coastal and mid-north wind corridors.
Rooftop Solar delivered 23.2% (3,430 GWh) at a low $15.84/MWh, supported by mild temperatures and high solar irradiance.
Utility-Scale Solar added 6.1% (907 GWh) at $49.57/MWh, maintaining steady production through the month.
Gas generation supplied 22.0% (3,248 GWh) at $234.26/MWh, playing its usual firming role during low-wind periods and evening peaks.
Battery discharge contributed 2.0% (301 GWh) at $230.72/MWh, reflecting strong participation in peak-price intervals and grid-stabilising services.
Distillate remained negligible at 0.04% (5.3 GWh) but was extremely costly at $1,165.57/MWh, used only during contingency events.
Weighted average prices by generation category in South Australia – October 2025:
- Renewables (Wind, Solar): $47.48/MWh
- Gas (including Distillate): $236.12/MWh
- Battery (Discharging): $230.72/MWh
October closed with modest spot prices across the National Electricity Market (NEM) but heightened operational complexity. While wholesale average settled at ~$51/MWh, the market logged repeated system-strength directions, major coal unit trips, and record low daytime demand, reinforcing structural risks even as pricing remained calm.
News Updates
System Strength Interventions Spike
Australian Energy Market Operator (AEMO) issued multiple directions for system strength in NSW and Victoria — including interventions in NSW on 5 October and again on 29-30 October.
In Victoria, non-credible contingency events on 15 and 16 October triggered synchronous support requirements.
These events highlight tightening synchronous generation margins and the increasing need for intervention in system operation.
Coal Reliability Back in the Spotlight
In Queensland, units at Callide Power Station tripped following severe thunderstorms — B2 on 28 October and C4 on 26 October — causing frequency drops and underscoring persistent reliability issues at ageing coal-fired assets.
Meanwhile, Victoria’s Yallourn Power Station units 3 & 4 tripped simultaneously on 16 October (c. 600 MW), and Loy Yang A A4 entered an unplanned outage on 15 October — both amplifying risks in the market’s baseload backbone. These outages reinforce the message: spot calm does not equal structural security.
Demand Softness & Renewables Overshoot
On 4 October the NEM recorded a new low operational demand (~9.4 GW) thanks to mild weather and strong rooftop solar output. Large-scale solar curtailment exceeded 70% over 4–5 October — a sign that midday generation is increasingly bottlenecked.
While daytime prices weakened, the underlying issue remains grid flexibility: how do you manage surplus renewables when storage and firming lag?
Network & Transmission Constraints
An unplanned outage of the Dapto–Marulan 330 kV line on 20 October triggered constraints that cut south-to-north flows into NSW and helped explain localised evening price pressures.
Delays to major transmission projects (VNI West, Marinus Link, EnergyConnect) remain headwinds to scale up renewables without increasing curtailment risk.
Policy Update: Transitional Security Services & Roadmaps
On 24 October, AEMO launched its Transitional System Security Services framework, recognising that system strength and inertia are becoming central to operational risk even as generation mix changes.
Queensland also released its 2025 Energy Roadmap (10 October) which includes possible life-extensions for coal plants such as Callide B — injecting policy uncertainty into future hedging.
Why It Matters
Reliability is increasingly operational not theoretical. Coinciding trips and directions across coal and renewables show the thinness in the system today.
Daytime price softness masks the tension in evening peaks which still rely on coal/gas or rapid battery discharge.
The futures curve remains elevated (~$97/MWh for 2026) because traders are hedging against structural risk, not assuming smooth transition.
With critical transmission/firming investments slipping, risk is being front-loaded into forward contracts rather than quietly absorbed.
Actionable Advice
For buyers with electricity contracts expiring in the next 6–12 months, October’s stability offers a strategic window to engage fixed-rate markets before summer demand tightens conditions.
Now is the time to reassess procurement timelines, evaluate how coal reliability and system strength risks affect your exposure, and layer contracts across multiple timeframes to balance capacity and energy price risk.
Focus on the structural factors most relevant to your operations — from ageing coal reliability and delayed transmission upgrades to gas volatility and renewable curtailment.
Understanding which risks drive your region’s pricing will sharpen negotiation strategy and support informed lock-in decisions ahead of a potentially volatile 2026.
Explainer: Why we focus on Wholesale Futures Prices
Futures Price: This reflects what the market expects wholesale electricity spot rates to be in future periods. The offers that commercial and industrial (C&I) customers receive via Leading Edge Energy are closely correlated to wholesale prices on the ASX Energy futures market; this is why we focus on these prices in our commentary.
Wholesale Spot Price: This represents how much the spot market is charging for electricity currently based on demand and supply. Spot prices go up when demand is high and supply is tight. You can view live Spot Prices here.
You can learn more about the difference between wholesale electricity futures and spot prices in our blog section.
Disclaimer: The information in this communication is for general information purposes only. It is not intended as financial or investment advice and should not be interpreted or relied upon as such.
We source, analyse, compare and rank commercial, industrial and multi-site energy quotes. Obligation Free.
Chat with one of our experienced consultants today and get the insights your business needs to help manage the risks associated with volatile electricity and natural gas markets. Our energy procurement service is obligation-free and provides a time-saving way of securing lower energy rates from our panel of energy retailers.

Get advice from our Energy Management Consultants

Krystle Will
Energy Management Consultant
Get in Touch
Feel free to call or e-mail us. Or just fill in the form below and we’ll contact you for an obligation-free discussion.
Are you ready to save on business energy costs?
Get StartedLeading Edge Energy is proud to be a signatory of the National Customer Code for Energy Brokers, Consultants and Retailers.