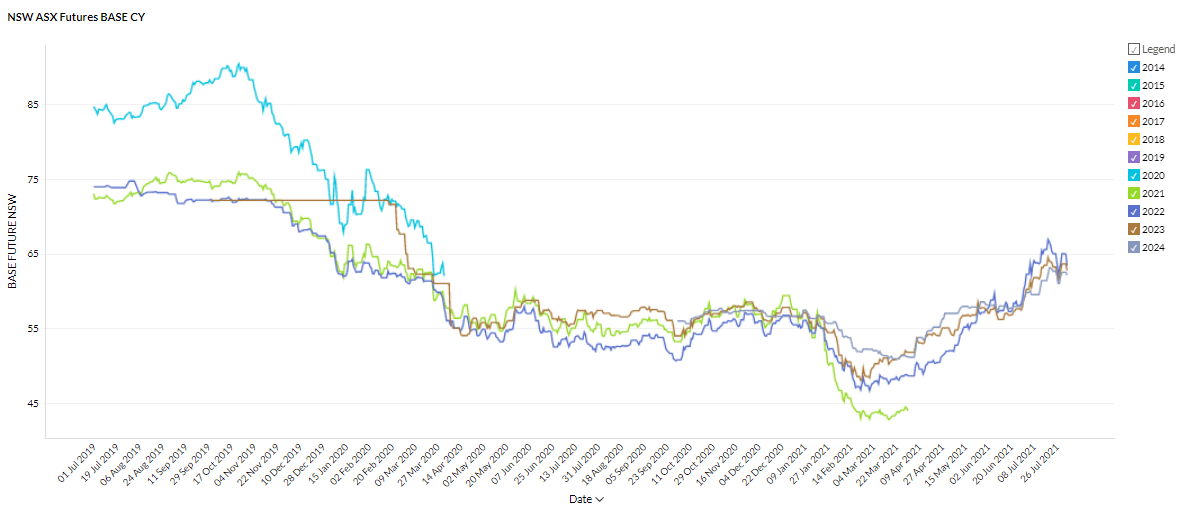
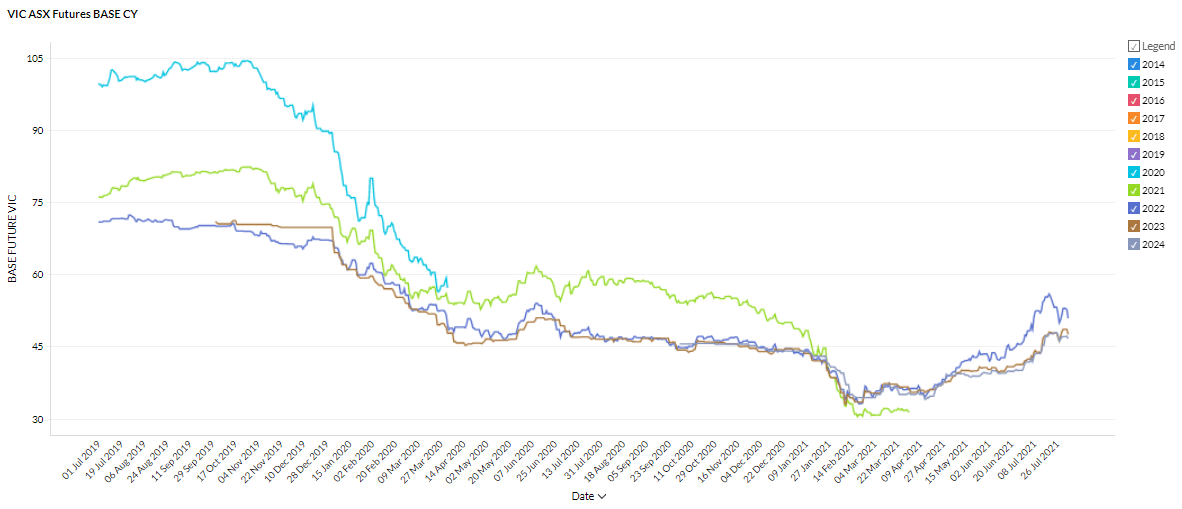
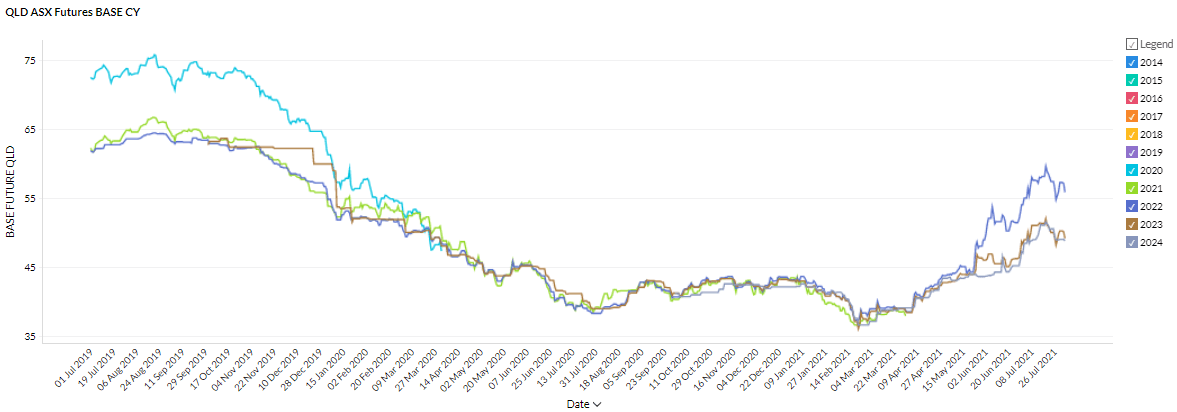
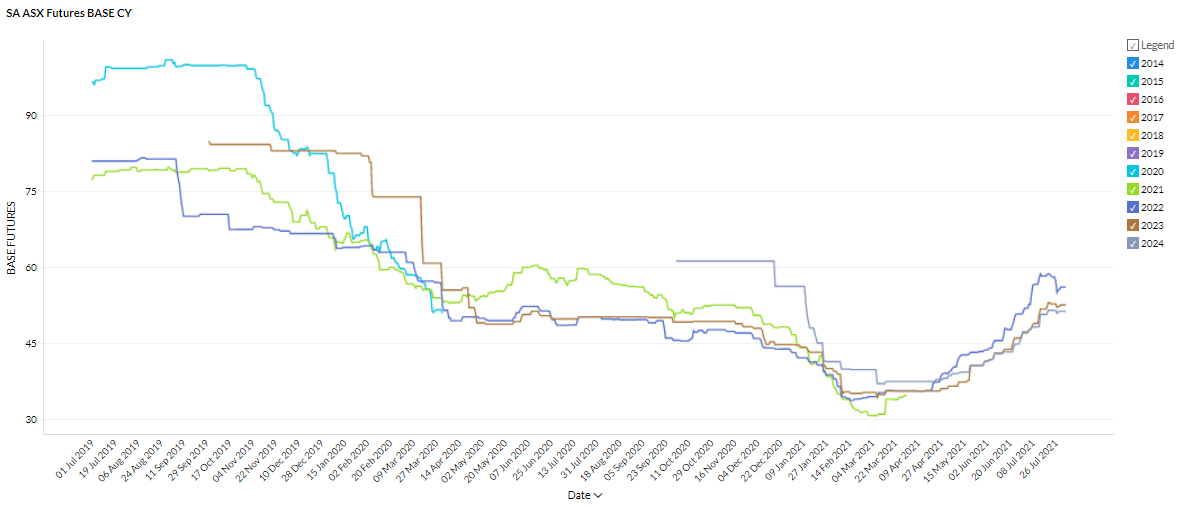
The price rise trend that began in February showed no signs of slowing down in July with futures contracts up between 4 and 15% across the NEM regions. Although the month saw record-breaking wind generation (up to 6,428MW at one point!) it wasn’t enough to offset the impact of the Callide explosion, Yallourn flooding, and exorbitant gas prices with high spot prices seen in all states. East Coast gas prices went through the roof as the fuel was called upon to fill the gap left by Callide and Yallourn and production at the Esso/BHP plant at Longford was disrupted. At one point Victorian prices reached $58/GJ – a 10-fold increase in prices seen earlier this year.
If you are looking to make sense of the chaos, check out Leading Edge Energy’s new analytical tools. And, as always, our energy experts are just a phone call away.
| INDICATIVE RATES | NSW | QLD | VIC | SA |
| PEAK | 8.07 c/kWh | 7.05 c/kWh | 7.49 c/kWh | 8.23 c/kWh |
| OFF-PEAK | 5.32 c/kWh | 4.8 c/kWh | 3.44 c/kWh | 4.43 c/kWh |
New South Wales

- Futures prices continued to rise throughout July with 2022 contracts soaring 10% and 2023 and 2024 contracts rising 7 and 5% respectively.
- Contracts are now trading between $62 and $65/MWh compared to a range of $42 to $52/MWh toward the beginning of the year.
How did supply and demand affect price?
- Spot prices were very high peaking at $5,176/MWh on the 14th July. There were 10 intervals priced above $1,000/MWh and 541 intervals priced above $100/MWh. For comparison there were just 53 intervals priced above $100/MWh in July 2020.
- The high prices are a result of the loss of supply following the Callide explosion in May – although the plant had restored 75% of capacity by the end of July – and soaring gas prices.
Victoria

- Victoria was the hardest hit with futures price increases over July.
- Contracts for all periods were up 12-15% building on consistent gains since early April.
- Contracts are now trading between $47 and $53/MWh with 2022 the most expensive period. Prices were under $35/MWh as recently as late February.
How did supply and demand affect price?
- With the flooding at Yallourn looking like it will continue impacting supply until early summer, record breaking gas prices and the long awaited “Big Battery” at Moorabool promptly catching fire soon after being turned on it’s safe to say Victoria has had a pretty bad month.
- As expected spot prices were high – over 500 intervals priced above $100/MWh peaking at $2,618/MWh and futures prices soared.
- The energy and manufacturing sectors were left reeling early in the month when gas spot prices rocketed to $58/GJ – 10 times the average price – prompting plant shutdowns and calls for federal government intervention.
- On a brighter note Victoria contributed the lion’s share of wind generation during a record breaking night- on the 25th of July 2,142MW of wind generation from Victoria combined with the other states to produce a new peak wind generation record of 6,428MW.
- Check out our new online analysis tools allow you to track the fuel generation mix in any state.
Queensland

- Queensland futures prices were highly volatile but by the end of the month had registered smaller gains than the other states.
- 2023 and 2024 contracts saw 4% gains over July while 2022 rose 6%.
- 2022 contracts spiked to ~$60/MWh on July 19 before finishing the month ~$57/MWh.
- 2023 and 2024 are trading around $48-50/MWh.
How did supply and demand affect price?
- Queensland continues to feel the effects of the Callide explosion and this loss of supply is being exacerbated by spiking gas prices.
- New analysis released by AEMO revealed that Queensland has just had its highest ever June quarter for wholesale electricity prices at $128/MWh highlighting the system’s vulnerability to thermal outages.
- Spot prices remained very high in July with 22 intervals priced above $1,000/MWh and just under 500 priced above $100/MWh. The peak was $6,563/MWh.
- Callide returned to 75% of capacity toward the end of July but the final unit is not expected to return to service until next year.
South Australia

- South Australian futures contracts continued to soar for most of July before pulling back or flattening toward the end of the month.
- 2022 contracts finished the month up 9% to $56/MWh after pulling back from a high of $58.50/MWh.
- 2023 and 2024 rose 12 and 9% respectively to finish the month between $51 and $53/MWh with prices plateauing in the final week of July.
How did supply and demand affect price?
- Gas is often the marginal price setter in South Australia hence it is exposed to the gas price spike currently occurring.
- Spot prices were high with close to 600 price intervals priced above $100/MWh and a peak of $2,100/MWh. At the other end of the spectrum high renewable penetration contributed to over 200 intervals priced below $0/MWh.
- South Australia was the second largest contributor to the new peak wind generation record set on July 25 offering up 1,696MW.
Futures prices are continuing to soar with most states now trading around the levels we were seeing early to mid-2020. The July 2021 energy market saw further supply-side disruption with strong renewable output a bright spot in an otherwise troubled month. The low prices seen in the first half of 2021 corresponded to a rare period of limited outages in the coal fleet and we are now seeing a return to ‘normal’. We believe these outages will only increase as our aging fleet struggles to operate in an increasingly dynamic environment. But we are here to help you navigate the changes and negotiate the best deal for your business – reach out now.
Disclaimer: The information in this communication is for general information purposes only. It is not intended as financial or investment advice and should not be interpreted or relied upon as such.


